By Linus Nilsson at NilssonHedge: Dispersion matters. If dispersion is high, there are two strategies for a fund selector. The first is to try to identify and allocate to the best-performing funds if you possess strong manager selection skills. The second is to allocate capital across as many managers as possible to diversify manager-specific risk. If dispersion is low, manager selection matters less, as all managers effectively become similar by broadly executing the same strategy. In that case, capital can be allocated to a single manager without taking on significant career risk.
Throughout 2025, we saw several CTAs point out that a small selection of large managers has exhibited an unusually wide range between the worst- and best-performing programs. A thoughtful analysis of the reasons behind this divergence was published by Quantica1, while others, such as CFM2, concluded that dispersion was no greater than average. Both articles present valid arguments.
Further attempts to explain divergence between managers was done by MAN Group that dived deeper into the subject3 highlighting how exposure to certain factors, sector tilts, and trading speed affects the outcome. Similarly, Bank of America has argued that specific design decisions largely determine the ex-post realized divergence from peers.
Given that trend followers are often viewed as a largely homogeneous group exhibiting similar characteristics (long-term orientation, momentum-based signals, long skew, crisis alpha, etc.), it is remarkable that divergence can appear either very large or very small, depending on how it is measured. We also frequently observe managers experiencing temporary underperformance citing elevated dispersion as a partial explanation for larger drawdowns.
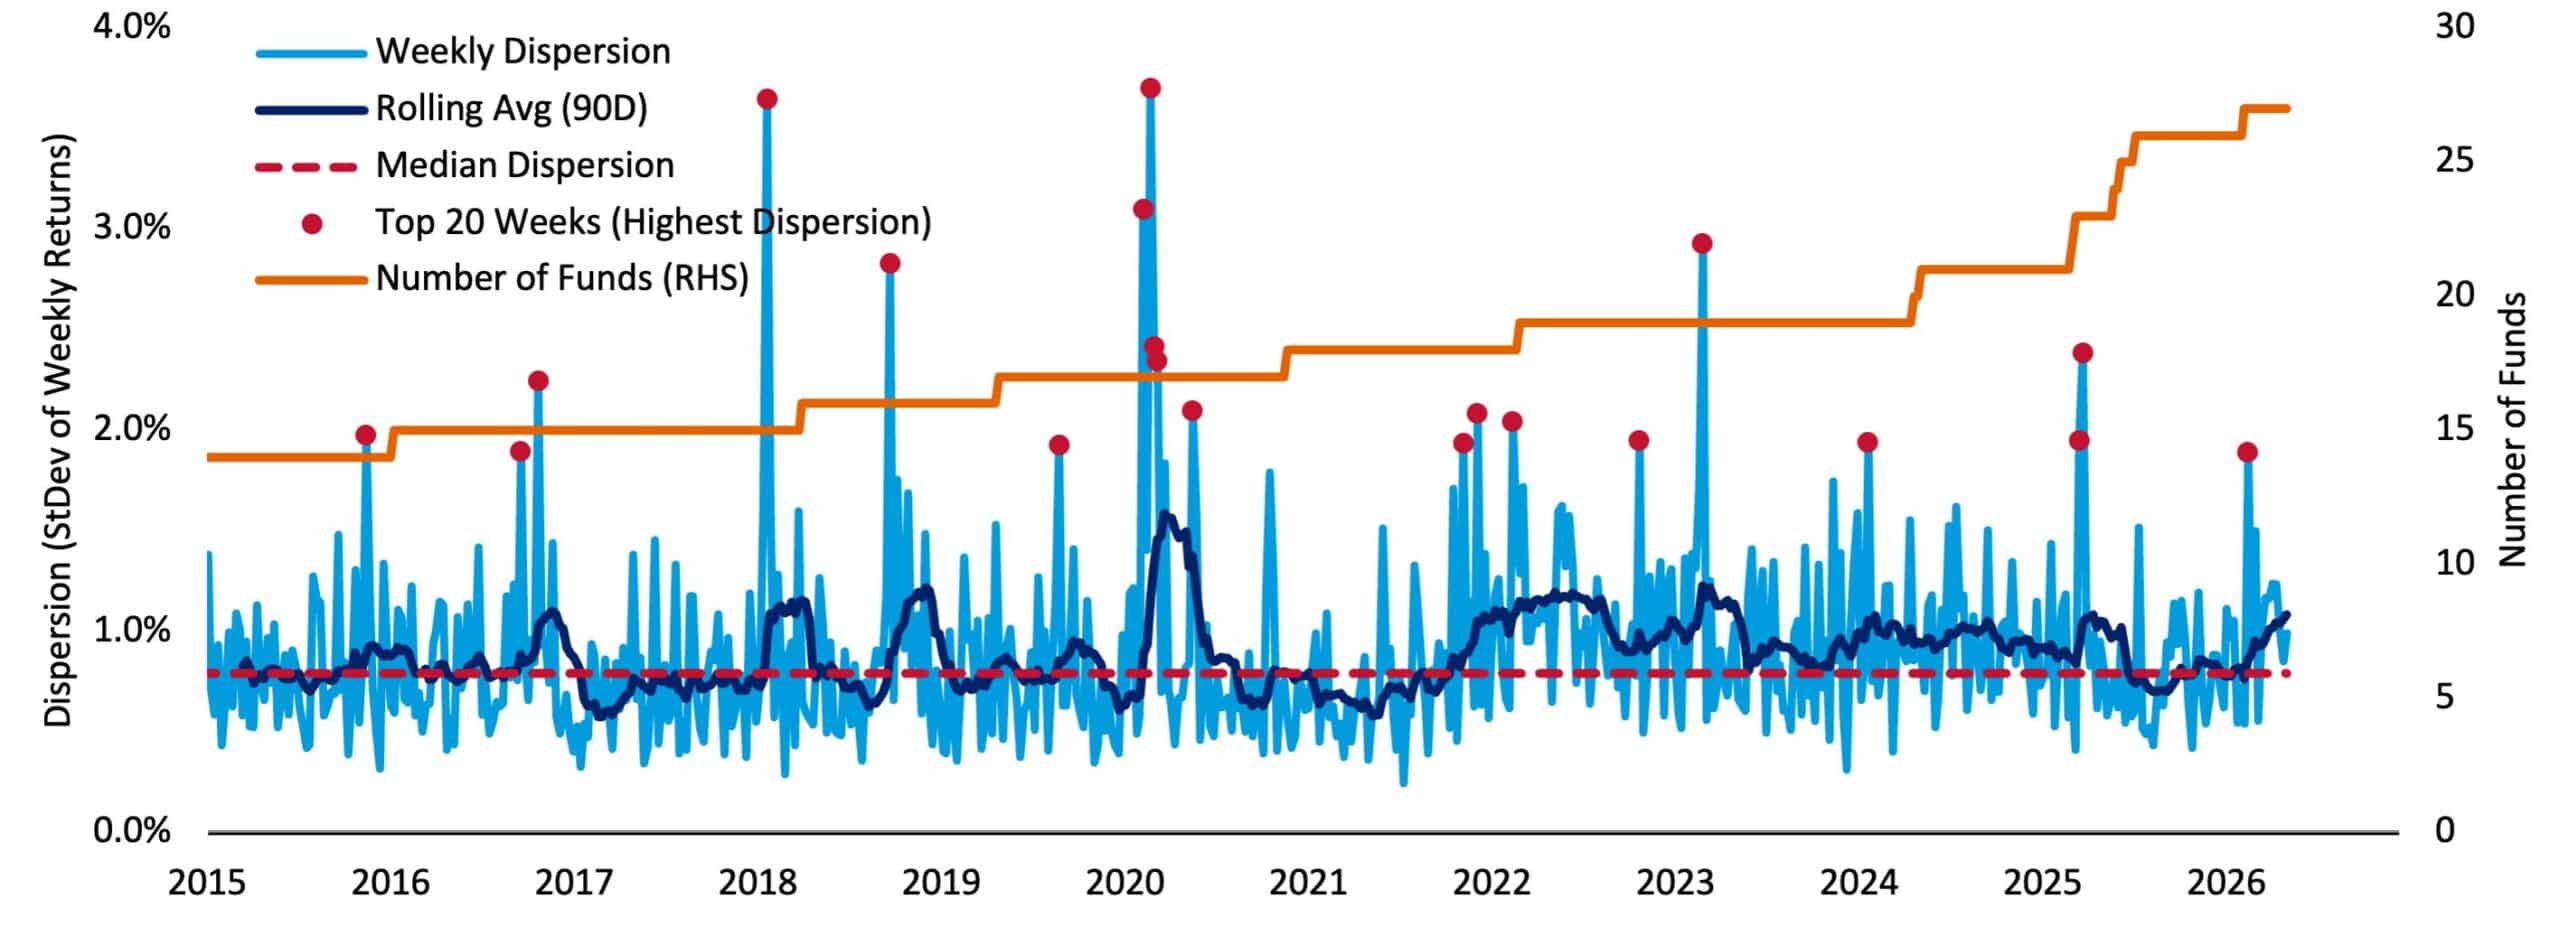
As seen in Figure 1, almost all the large divergences occur during weeks with large macro events. The highest weekly dispersion readings tend to coincide with periods of market stress. While dispersion is currently above its long-term average, it appears relatively stable when viewed over a longer horizon.
Using one of the largest databases available for CTAs (NilssonHedge). We calculate several dispersion-related measures across managers. Since the early 2000s, we have collected return data on more than 600 trend-based managers. We believe the sample is reasonably free from pre-production strategies (i.e., simulated returns) and is not affected by survivorship bias.
We ignore size and focus purely on the realized returns. Given the scalability of trend following (due to the exposure to large liquid markets and relatively slow changes in positions) size is a less relevant sorting variable, at least from this perspective. Small and large managers use the same strategy, and similar markets. Otherwise, they would not be correlated. Thus, we find it reasonable not to condition the sample on size herein.
Low Dispersion?
There are multiple ways to define dispersion. A reasonable definition is to use the “interquartile range”, i.e. the distance between the 25th and 75th percentile. We track this measure back to 2015 using monthly data.
As noted above, dispersion is often driven by large divergences in the top and bottom quartile around major market event, such as the Feb 18 equity market correction, Covid, the Ukrainian invasion, Liberation, and the Iran war. Unexpected market events.
Short-term dispersion is almost always due to luck, with a manager having the right or wrong position going into a particular event. Post an event, reactions can be evaluated, how the signals changed and if risk management forced positions to be reduced. This can relate to subtle differences in parameter configuration, having a particular market, or a sector tilt. To visually identify any trends in dispersion, we plot rolling averages over different time horizons. The results are presented in Figure 2. Monthly dispersion occasionally spikes but reverts in subsequent months. High dispersion predicts low dispersion in the next period. That said, it is hard to see any sustained trend in the data. Overall, nothing appears elevated, and if anything, rolling dispersion on a yearly horizon is low relative to its own history.

High Dispersion?
We move away from the noise that month-to-month returns represent and focus on the rolling risk-adjusted annual performance to reduce the influence of a few highly volatile managers.
As before, we divide the sample into quartiles. The realized rolling Sharpe ratios are highly correlated, suggesting that managers are exposed to many of the same underlying return drivers.
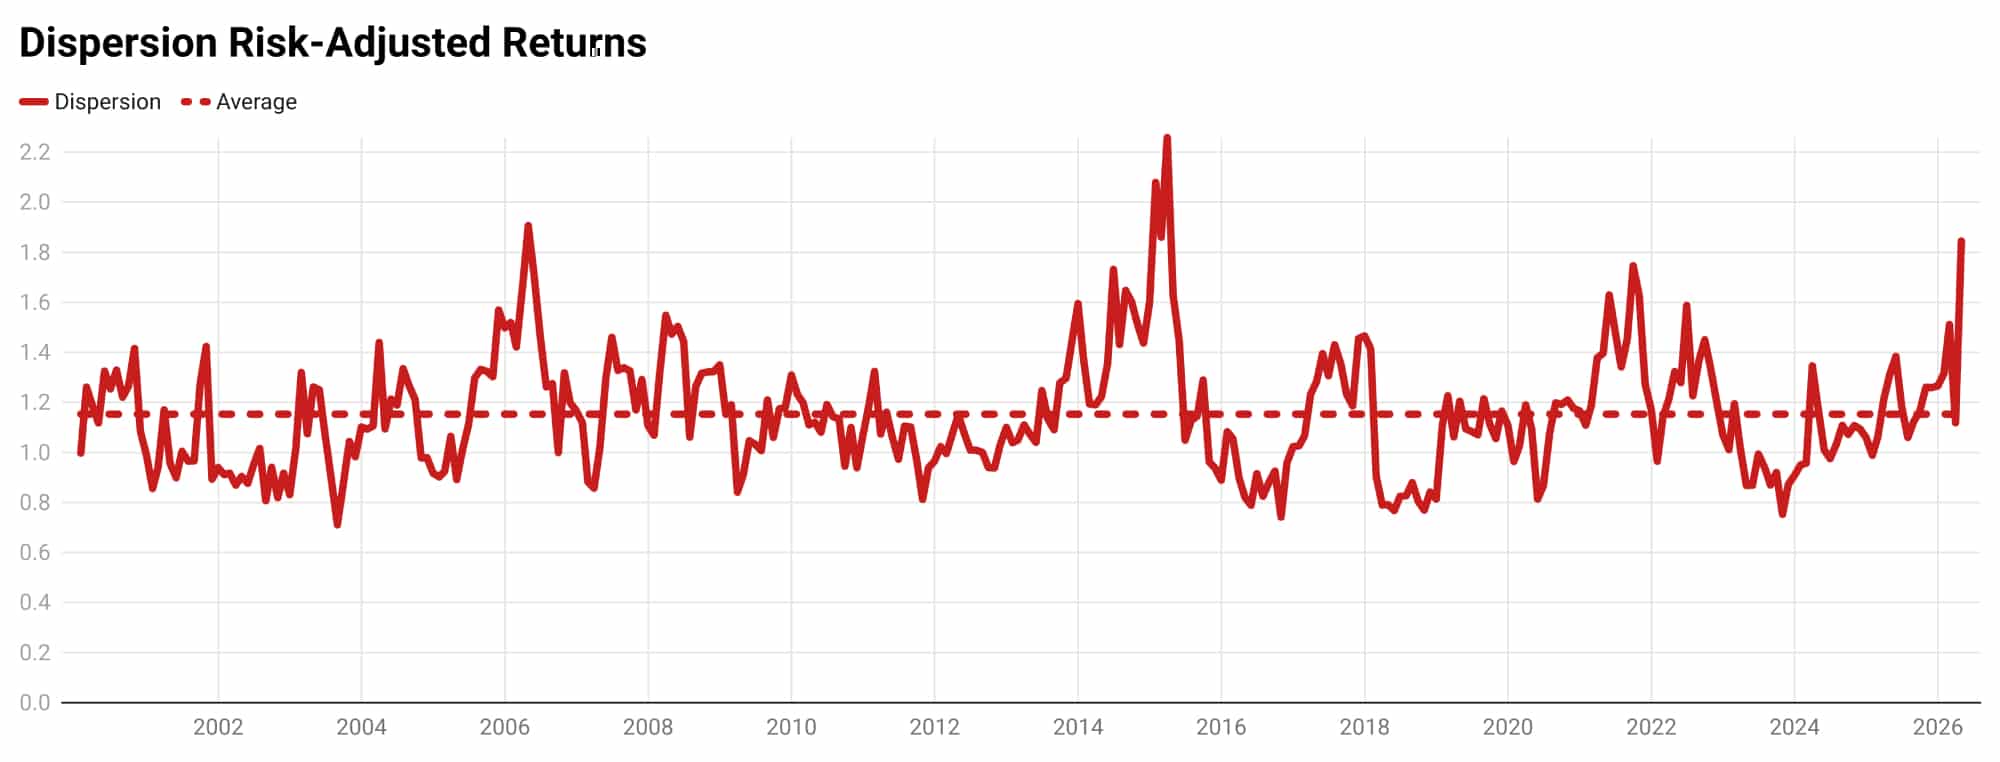
When examining rolling risk-adjusted performance dispersion, a somewhat different picture emerges. Dispersion is close to all-time highs. This finding supports the views of industry participants who have observed elevated realized dispersion.
Reading the tea leaves
While we found that monthly dispersion is roughly in line with historical averages, we noted that annual dispersion was much higher than normal. Does this indicate something meaningful, or are we simply torturing the data?
As it turns out, when comparing a manager’s current ranking with its ranking in a subsequent period, we find that the correlation is persistently negative. In other words, managers with high risk-adjusted performance generally performed less well in the following period, relative to peers.
In conclusion, monthly dispersion has remained stable and well contained over the past 10 years, while annual risk-adjusted performance exhibits clearly elevated levels of dispersion. As a result, manager selection has mattered, and concentrating capital among too few managers has carried a high risk of underperforming a benchmark However, if you happen to have invested with a trend strategy that has performed exceptionally well, you should not expect that outperformance to persist in the next period.
The best cure for low performance is low performance.
1 https://quantica-capital.com/en/publication/qi-2025Q4
2 Steady Trends: The Reality of CTA Return Dispersion – CFM
3 https://www.man.com/insights/deep-dive-trend-following
Linus Nilsson wrote this article in his capacity as founder for NilssonHedge, a hedge fund database. The article does not necessarily reflect the views and opinions of current, future, or past employers.