By Man Group: Having reached an inflection point in the rates cycle, investors may be wondering what to expect from trend-following strategies. Towards the end of 2023, the ‘higher-for-longer’ narrative evaporated as inflation moderated. The Federal Reserve’s (Fed) dovish pivot in December signalled not only the end of one of the most aggressive rate hiking cycles in modern history, but also that rate cuts were firmly on the roster for 2024, with the Fed dot-plot pricing in 75bp of cuts over the course of the year.1
We do not have to go back far to see how trend-following performs during rate hiking cycles. 2022’s blockbuster performance2 was a prominent example, with the Barclay BTOP50 Index (BTOP50)3 returning 15%. But as we now stand at an important inflection point, investors may be wondering how trend-following performs during rate cutting cycles.
To help answer this, we compare the performance of the BTOP50 since its inception in 1987 against the Federal Funds Target Rate (FFTR), denoted by the grey shaded area in Figure 1. The performance of the BTOP50 is then plotted relative to two distinct environments: firstly, when the FFTR is rising (yellow line in Figure 1) and secondly, when the FFTR is being cut (light blue line in Figure 1).
Whether a period is classified as a hiking cycle or a cutting cycle is determined by the 12-month forward level of the FFTR. If this is greater or equal to 75bp, it is classified as the former and if it is less than or equal to -75bp, it is classified as the latter. The rationale for choosing this classification is twofold; firstly, it aligns with the Fed’s latest dot-plot, which forecasts 75bp worth of cuts over 2024, and secondly, it accounts for the fact that interest rates lag inflation, so goes some way towards capturing the forward-looking nature of monetary policy, as well as the movements in asset prices that are driven by a change in expectations. For completeness, we also plot the returns corresponding to the periods where the FFTR is largely static (dark blue line in Figure 1). Performance is then held constant when the environment switches.
Figure 1. Performance of BTOP50 in rising (yellow), falling (light blue) and static (dark blue) rate environments
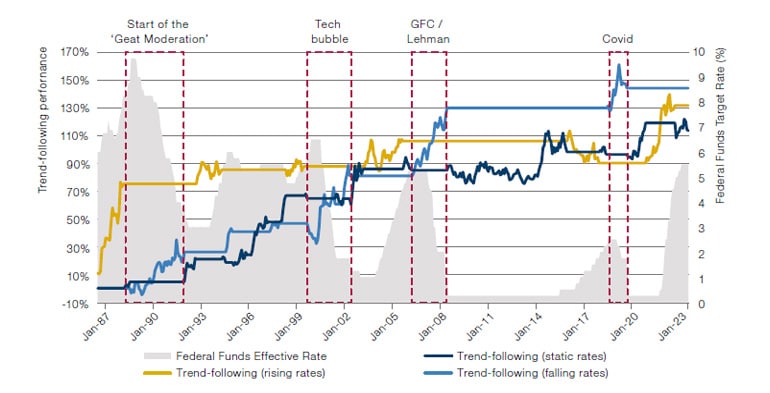
The first observation we can make from Figure 1 is that trend-following performance is positive during the majority of hiking cycles classified over the period, with an annualised return for the BTOP50 of 8%. 2022 helps validate this observation as trend-following profited from sizeable trends in fixed income markets and the US dollar, which were precipitated by the Fed’s unprecedented hiking cycle, to the tune of 425bp.
The second, and more pertinent observation given the current environment, is that trend-following performance has been positive during each cutting cycle since the 1980s, with the BTOP50 annualising 9%. Indeed, it can be observed that the relationship is more pronounced during cutting cycles than over hiking cycles.
Finally, over periods where rates are relatively static, we find that the annualised performance of the BTOP50 is 5%, underperforming the BTOP50 during both cutting and hiking cycles.
Conclusion
The above analysis provides a historical view of trend-following performance, which could apply to future rate cutting cycles. It is analogous to the analysis undertaken by Neville4 which examines around a century of data to show that trend-following is not only a robust performer during inflationary periods in general, but also in the six-and 12-month timeframes following inflation’s peak.
The article was originally published here.
With contributions from Rupert Goodall, Client Portfolio Management Analyst, at Man AHL.
1. Source: Federal Reserve triggers market rally as it signals interest rate cuts in 2024 (ft.com).
2. Source: 2022: The Year of Traditional Trend-Followers – HedgeNordic.
3. The BTOP50 Index seeks to replicate the overall composition of the managed futures industry with regard to trading style and overall market exposure. The BTOP50 employs a top-down approach in selecting its constituents. The largest investable trading advisor programs, as measured by assets under management, are selected for inclusion in the BTOP50. In each calendar year the selected trading advisors represent, in aggregate, no less than 50% of the investable assets of the Barclay CTA Universe.
4. Neville, H., “The Road Ahead: Inflation Can Go Down as Well as Up”, May 2022. www.man.com/maninstitute/road-ahead-inflation-up-down