(Partner Content From CME Group) – Recent changes in geopolitical trade policy and resulting tensions have put commodity markets on the front line of the U.S.-led trade war. As global supply chains shift and trade policy from the governments of the world’s largest commodity buyers and suppliers becomes ever increasingly dynamic; global commodity benchmarks, such as CME Group’s Agricultural futures and options, have echoed these changes.
While volatility in commodity markets is not unusual, the magnitude and impact of this year’s trade war has added an extra measure of uncertainty to the mix. This paper will briefly review some of those effects as they relate to U.S. agricultural trade and CME Group agricultural futures and options.
Projected Impact on U.S. Agricultural Trade
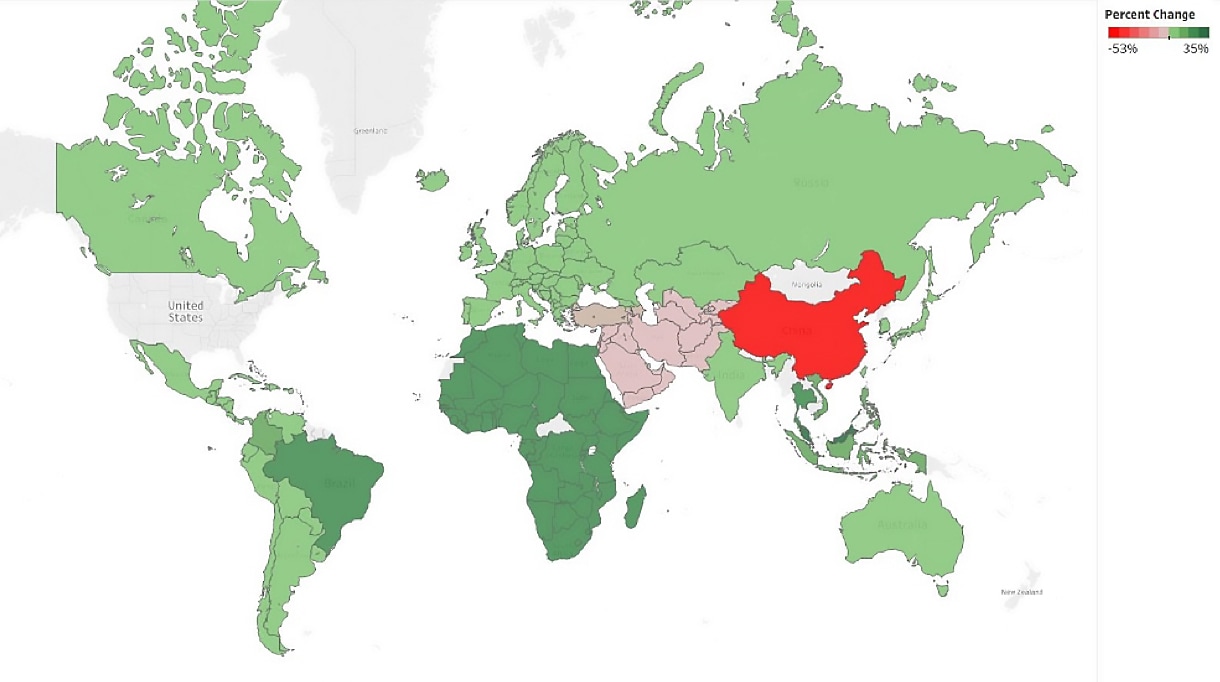
Data from the recently released Outlook for U.S. Agricultural Trade, by the USDA’s Economic Research Service, indicates 2019 agricultural export values are projected to total $141.5 billion, approximately $2 billion less than fiscal year 2018 and down $3 billion from the August forecast.
In recent years, U.S. agricultural exports to China, Mexico, Canada and Japan have represented approximately 50 percent of the total U.S. agricultural export value. This aggregated share is projected to decrease to 44 percent, as modest 1-3 percent projected gains with Mexico, Canada and Japan will be more than offset with projected loss of market access with China. On average, from 2015 through 2017, the Chinese market accounted for 15.7 percent of the total U.S. agricultural export value.
The forecast anticipates a significant 53 percent reduction in U.S. agricultural export value to China, from $19 billion in 2018 to $9 billion in 2019. This reduction is largely attributed to declining Chinese purchases of U.S. soybeans due to trade tensions and further compounded by record high 2018 U.S. soybean crop yields pressuring prices even lower.
Figure 1: Projected Percent Change in U.S. Agricultural Export Value, 2018 to 2019
Source: USDA ERS, “Outlook for U.S. Agricultural Trade”
Outside of China and the Middle East, 2019.1 U.S. agricultural export values are projected to increase an average of 8 percent year-over-year among the other top 25 major international trading partners, driven in part by higher corn and wheat volumes. Africa, Brazil, and Malaysia are expected to see the largest year-over-year percent increases from 2018 to 2019.1
Soybean Impact
Nowhere has the impact of the trade war been more pronounced, at both a macro- and micro-level, than the soybean markets. For example, at the micro-level:
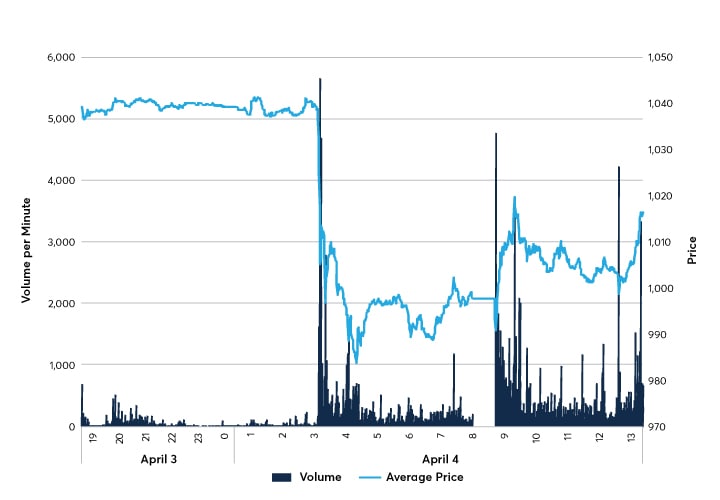
- April 3, 2018: The U.S. government releases $50 billion list of 1,333 Chinese products under consideration for 25 percent tariffs
- April 4, 2018: China publishes a list of 106 U.S. products subject to forthcoming 25 percent tariffs as retaliation, including soybeans
Figure 2: April 3 and 4, 2018 Nearby CBOT Soybean Futures Trading Volume and Price
Source: CME Liquidity Tool
Figure 2, generated using data from the CME Liquidity Tool, shows that at roughly 3:00 a.m. CST, or 5:00 p.m. in Beijing, the nearby CBOT Soybean futures price decreased almost 5 percent, and experienced a sharp increase in trading volume in the two hours subsequent to China’s announcement of retaliatory tariffs.
The interactive CME Liquidity Tool provides access to current and historical liquidity for products offered on CME Group exchanges across three distinct global time zones. The tool leverages market data reconstruction to visually display and analyze liquidity measures such as bid-ask spreads, book depth and cost of trade statistics.
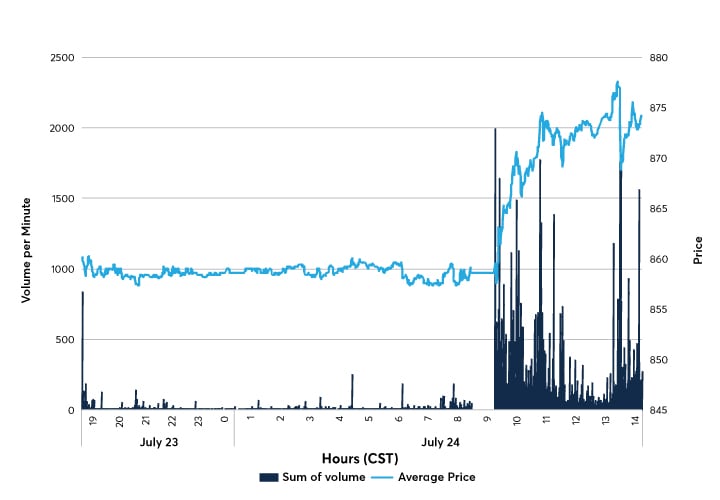
Conversely, and perhaps displaying the asymmetric impacts and degree of “good versus bad” news, Figure 3 shows an approximate two percent increase in the CBOT Soybean futures price over the course of the July 24 trading day, and a moderate spike in trading volume following the U.S. government’s announcement to subsidize U.S. producers for up to $12 billion for lost export sales.
Figure 3: July 24 Nearby CBOT Soybean Futures Trading Volume and Price
Source: CME Liquidity Tool
Although different directions, both Figure 2 and 3 demonstrate the efficiency and effectiveness of the CBOT Soybean futures contract actively facilitating real-time price discovery and risk management, regardless of the hour of the day.
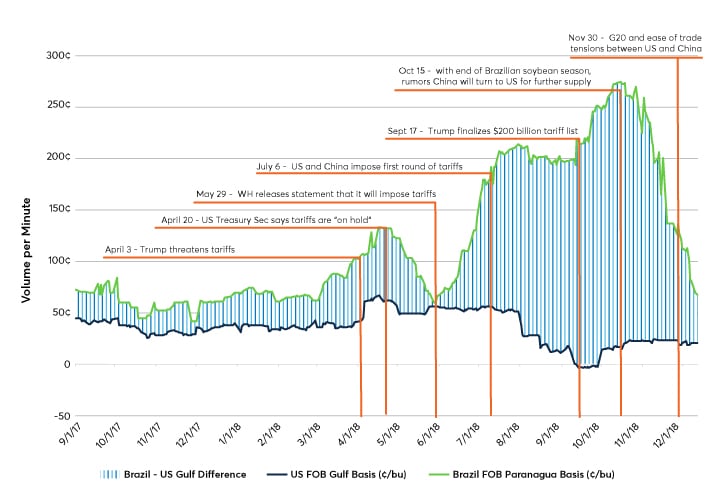
On a macro-level, the effects of tit-for-tat tariffs and subsequent easing of tensions around the time of the G-20 meeting can be seen in the divergence and convergence in soybean basis between the U.S. Gulf and Paranagua, Brazil in Figure 4.
Basis, often referred to as the “voice of the grain markets,” is the difference between the cash price and nearby futures. This difference serves as an indicator of local supply and demand fundamentals in relation to global price benchmarks, such as CBOT Soybean futures. A strong and wide positive basis, such as FOB Paranagua in September 2018, indicates a tight supply and strong demand for Brazilian-origin soybeans. In contrast, a weak and narrow basis indicates an oversupply and low demand for U.S.-origin soybeans. With China being the largest buyer of soybeans in the world, the shifting of Chinese demand has a substantial impact to export balance sheets and regional price differences.
Figure 4: U.S. FOB vs Brazil FOB Soybean Basis
Source: Commodity3, USDA
In 2018, Brazil exported a record 83 million tons of soybeans, driven heavily by Chinese demand. Approximately 82 percent, or 69 million tons, of Brazil’s soybean exports were destined for China. In contrast, the U.S. 2018 soybean exports totaled 37 million tons, with only 8 million tons directed towards China.
In terms of “soybean vessels to China,” the 2018 exports comparison is even more striking. Assuming each vessel carries 60,000 tons of soybeans, Brazil exported 1,152 vessels, while the U.S. exported 136 vessels, a ratio of almost 9:1.2
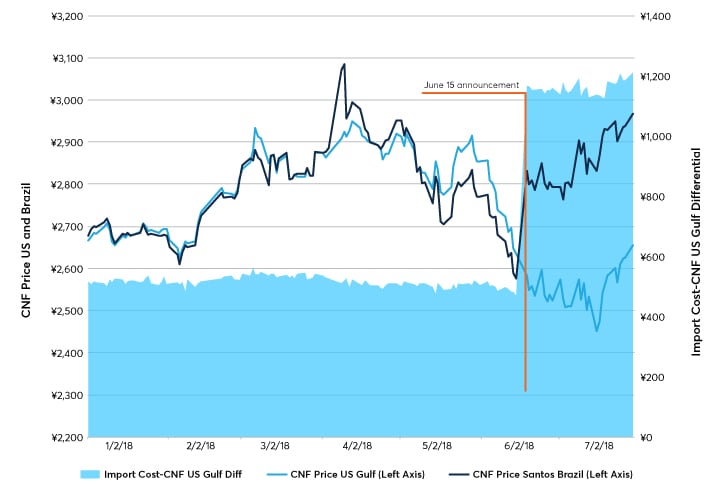
On June 15, China finalized and announced their list of $50 billion worth of U.S. goods subject to 25 percent tariffs, including U.S. soybeans. Driven more by policy than price, China turned to Brazil to meet the majority of their 2018 soybean demand. The inelasticity of China’s demand, combined with the 25 percent tariff, was highly beneficial to Brazilian soybean exporters. These exporters were able to capture part of the added cost of the tariff imposed on U.S. agricultural goods, as an added premium to the Brazilian Soybean CNF price (see Figure 5). While the cost for Chinese buyers to import U.S.-origin soybeans rose substantially, at the same time the price for Brazilian soybeans increased approximately 15 percent as an indirect reflection of the tariff imposed on U.S. soybeans.
Figure 5: Impact of Tariff on Chinese Import Costs of U.S. Soybeans vs. CNF U.S. Gulf and Brazil Santos
Source: Bloomberg, JCI
Market Volatility
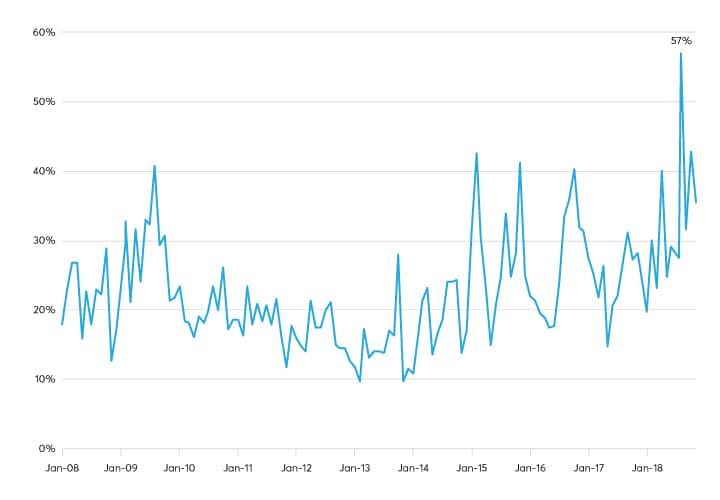
Volatility and uncertainty from the trade war have not been isolated to soybean markets. Almost a quarter of U.S. pork production is designated for export, with China the largest consumer of pork in the world, and Mexico the number one importer of U.S. pork by volume and number two by value. With record U.S. hog inventory and an industry in expansion mode to sustain a growing export market, the vulnerability to adverse marketing conditions was exposed when China and Mexico imposed retaliatory tariffs on U.S. pork products in summer 2018. As a result, the price of nearby CME Lean Hog futures decreased approximately 41 percent. Subsequently, reports of African Swine Fever (ASF) outbreaks in China helped pork prices recover modestly later that summer. These combined price swings marked August 2018 as the highest monthly historic volatility for the contract in more than 20 years, hitting 57 percent.
Figure 6: CME Lean Hog Futures Monthly Historic Volatility
Source: CME Group
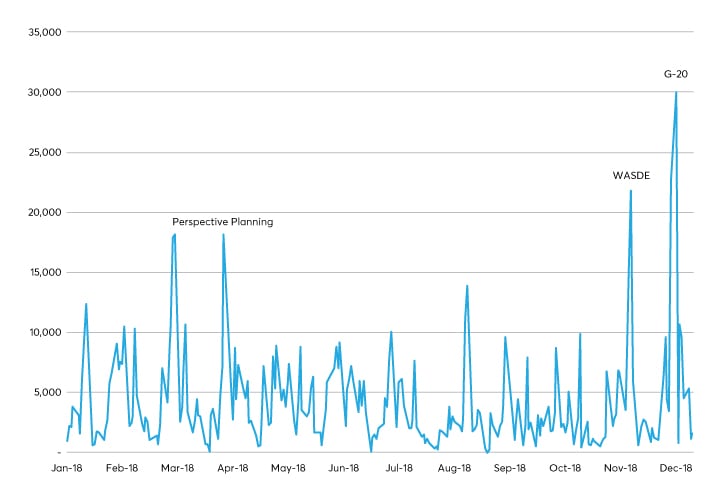
Further demonstrating CME Group’s deep liquidity and ability to facilitate risk management around major events, a record 30,000 Weekly Agricultural options traded on December 3 as global participants reacted to G-20 meeting outcomes and further anticipation of easing trade tensions between China and the United States.
CME Group’s Weekly Options on Futures offer a precise and cost-effective way to mitigate risk and capture opportunities associated with market-moving events through access to optionality at specific junctures in time and term structure. For example, the Week 1 March options expiration coincides with the March 1 deadline for U.S.-China trade negotiations.
Figure 7: CBOT Grain & Oilseed Weekly Option Volume
Source: CME Group
Summary
With a looming March 1 deadline for a successful end to U.S.-Chinese trade negotiations, there are several critical questions to which the global markets are eagerly awaiting answers: Will China return to the U.S. agricultural market in strength? Will once-established supply chains remain intact? How will producers and agricultural value-chain stakeholders across the globe adjust their operations in anticipation of the outcome of a potential agreement or lack thereof?
While the trade war has introduced unforeseeable and ongoing volatility into the United States and world agricultural markets, CME Group’s futures and options contracts remain the leading global benchmarks in reflecting the dynamics of world agricultural markets.
For further information on CME Group’s agricultural futures and options, visit cmegroup.com/agriculture.
Sources:
- Bryce Cooke and Hui Jiang. Outlook for U.S. Agricultural Trade, AES-106, U.S. Department of Agriculture, Economic Research Service, November 29, 2018.
- “AgriCensus Export Dashboard for Global Wheat, Corn and Soybean Trade Data.” Census Commodity Data Ltd, https://www.agricensus.com/export-dashboard/.
- Bown, Chad P., and Melina Kolb. “Trump’s Trade War Timeline: An Up-to-Date Guide.” Peterson Institute for International Economics, 1 Dec. 2018, https://piie.com/blogs/trade-investment-policy-watch/trump-trade-war-china-date-guide.
Picture: (c) Africa Studio—shutterstock.com

