Stockholm (guest contribution by RPM): Historically, the first three quarters during US presidential election years have been difficult for CTAs. However, the 4th quarters have, on average, strongly outperformed. There are good reasons for this.
CTA performance during election years
First observation: CTA performance during US presidential election years have on average been worse than other years.
Second observation: CTA performance during the 4th quarter of US election years have on average been significantly better than other years.
The graph below shows the BTOP 50 average and median excess returns during election years and non-election years plus the average and median excess returns during the 4th quarter.
“Excess returns” are the actual monthly returns minus the 3-month US interest rate.
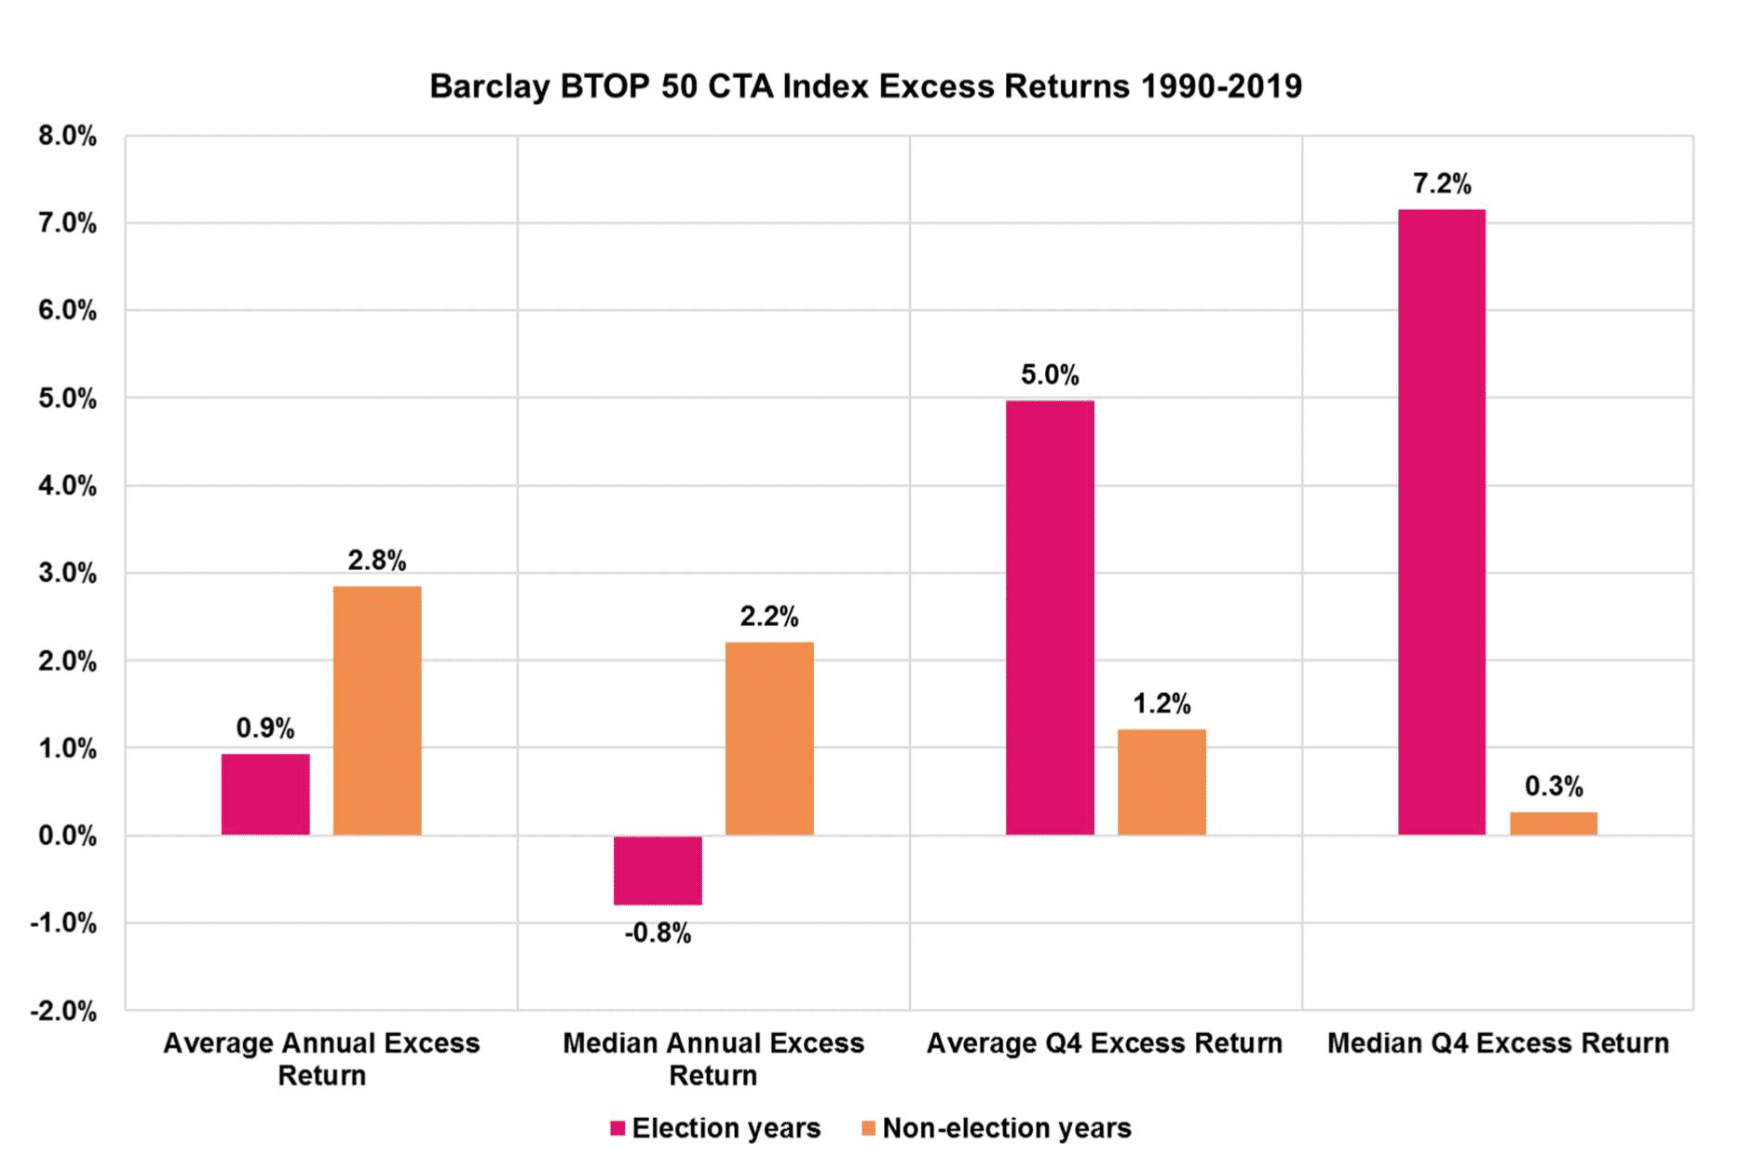
Notably, the average Q4 excess return has been 5.0% during US election years and 1.2% all other years, since 1990.
This makes intuitive sense, as most elections have been associated with initial uncertainty and erratic market movements. However, as the election moves closer, polls may gradually reduce uncertainty and when the election result is in, markets typically regain directionality.
There are exceptions, i.e. when the Barclay BTOP 50 has generated negative returns during 4th quarters. 2016 is the worst example: the index lost (in actual terms) 2.6%, mostly in October.
The average of the actual positive returns for the winning 4th quarters during election years is 11.3%. The corresponding average loss is 1.7%.
Time Series Momentum in election years
Time Series Momentum (TSMOM*) is the principal risk factor behind CTA returns. The graph below plots TSMOM since 1992 with all US presidential election years shaded. Falling and low TSMOM is strongly associated with weak CTA performance while rising and high TSMOM is associated with strong CTA performance.
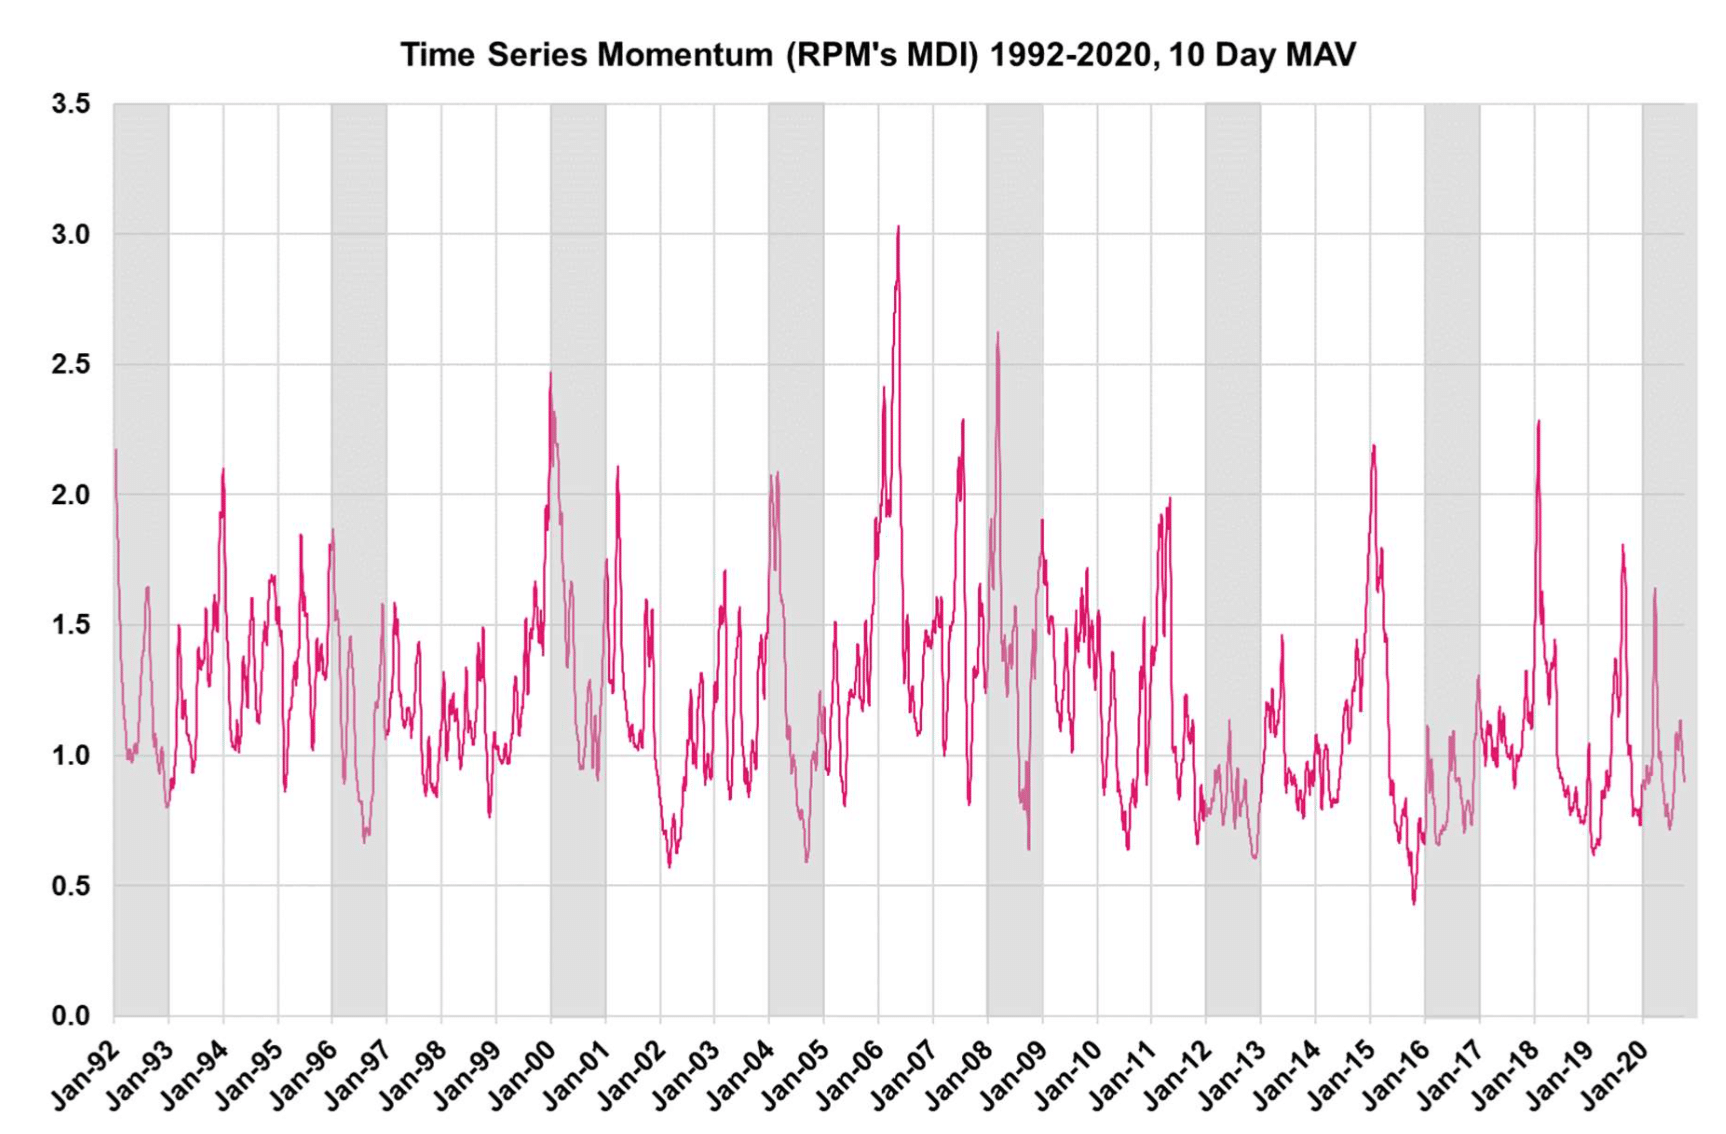
Notably, all election years have had low, falling and/or erratic TSMOM most of the year (which explains the lower than average annual performance) but ended the year on a strong note which explains the superior 4th quarter performance. 1992 is the only exception.
US election years are different
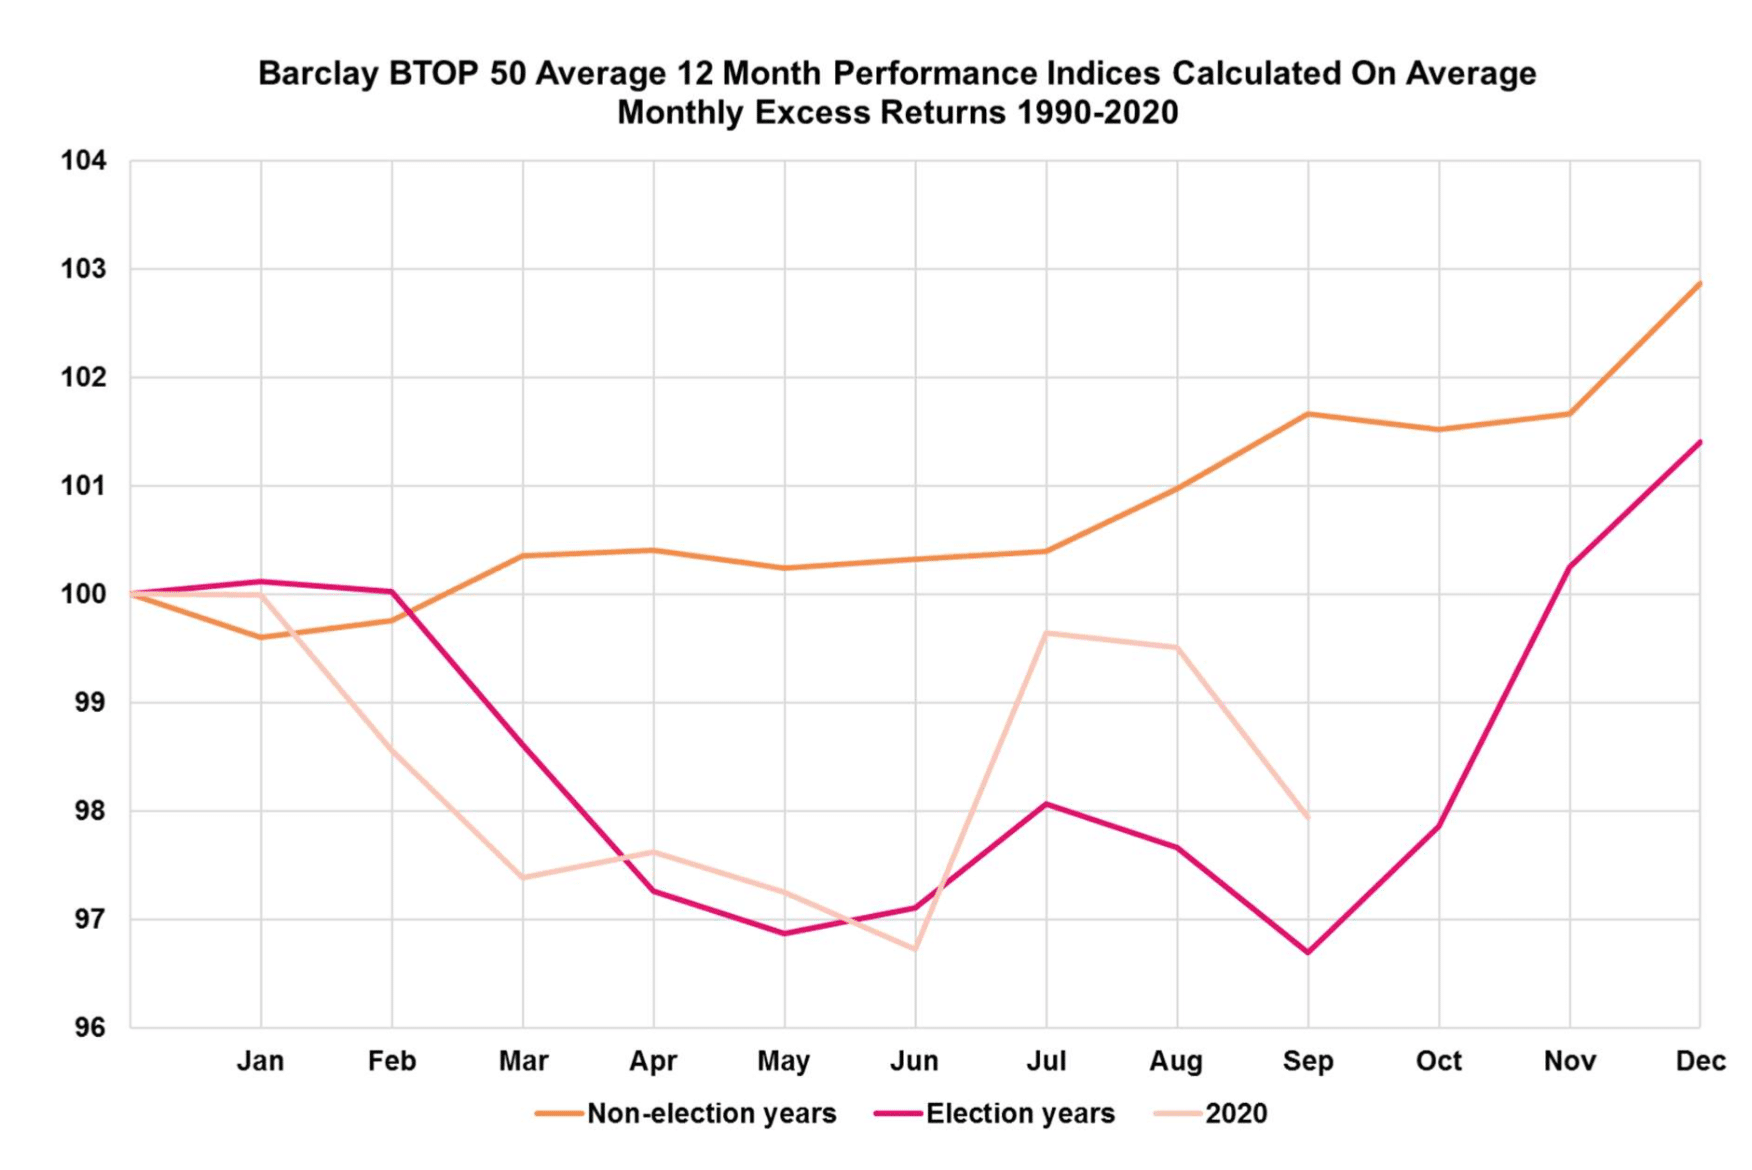
Election years seem to differ from other years as illustrated by the graphs below. In non- election years, December has, on average, been the strongest month, followed by September. In election years, November has been the strongest month followed by October.
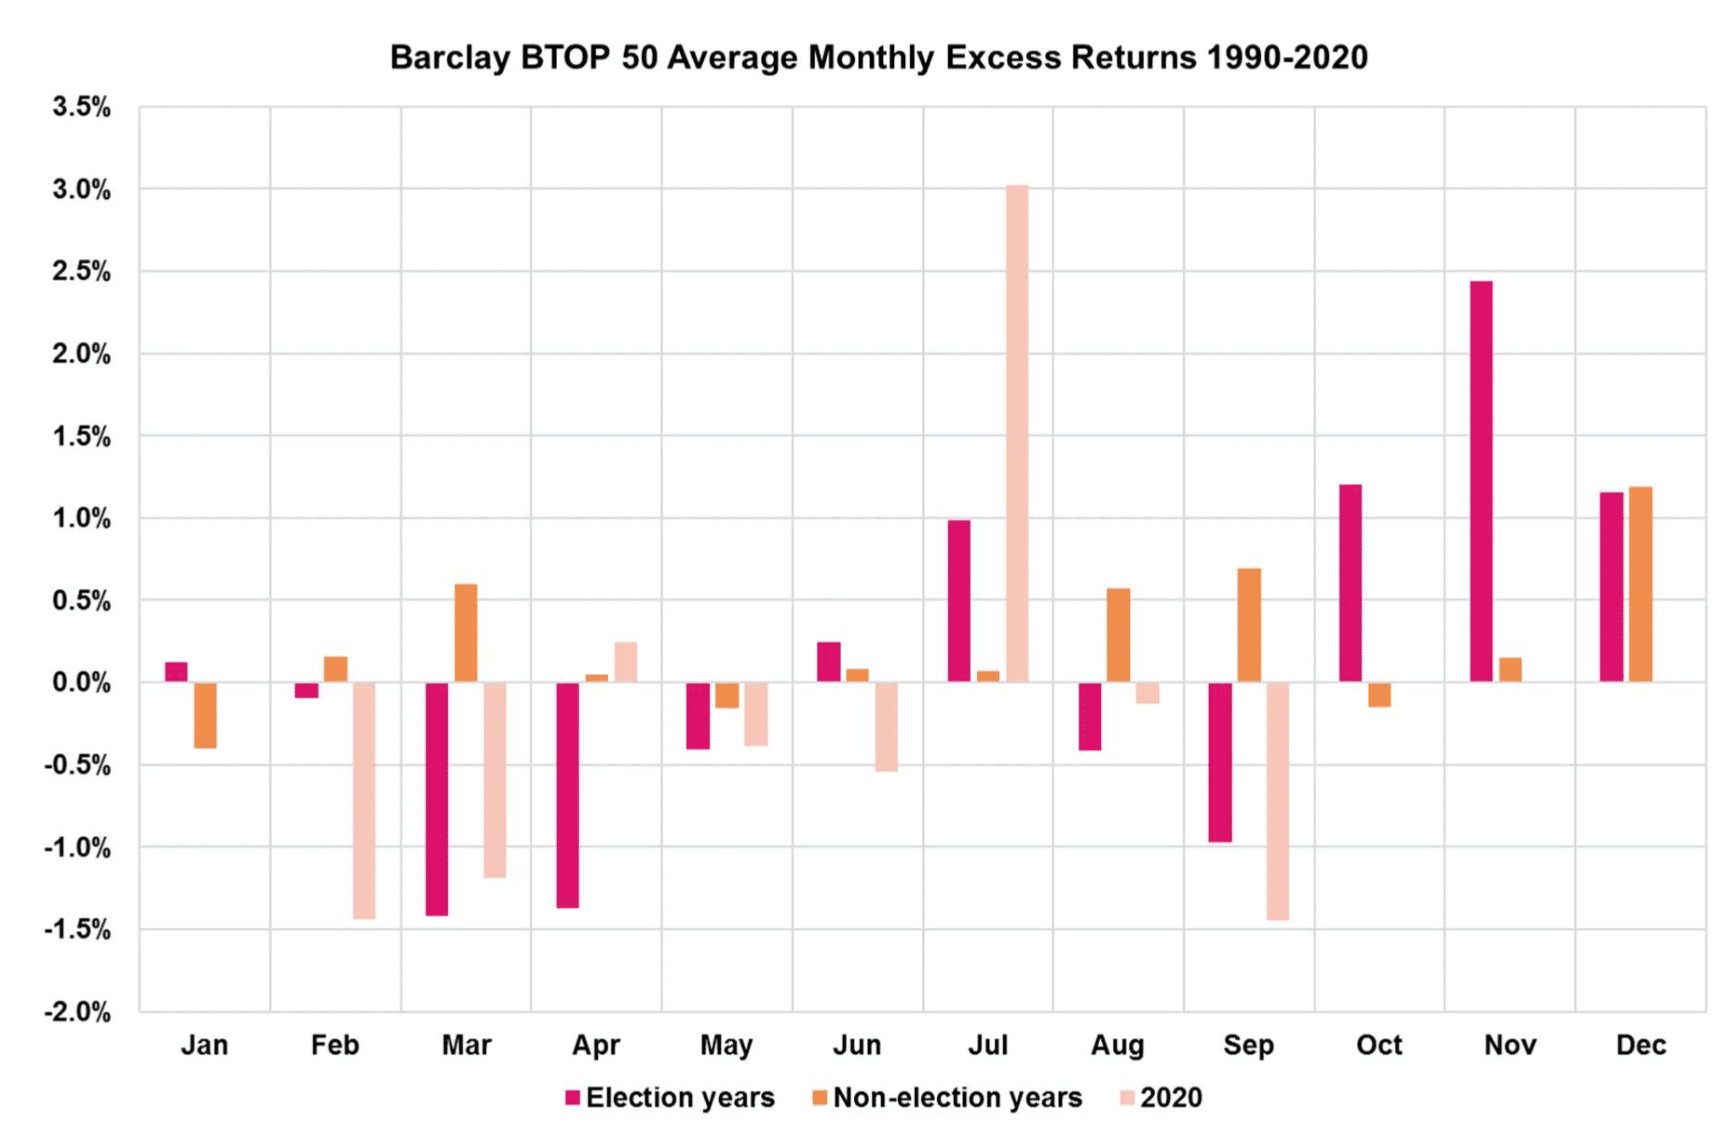
So far, in 2020, CTA performance is in line with how CTAs have performed historically during the first three quarters in election years, albeit somewhat better, despite the dislocations caused by the Corona-virus pandemic.
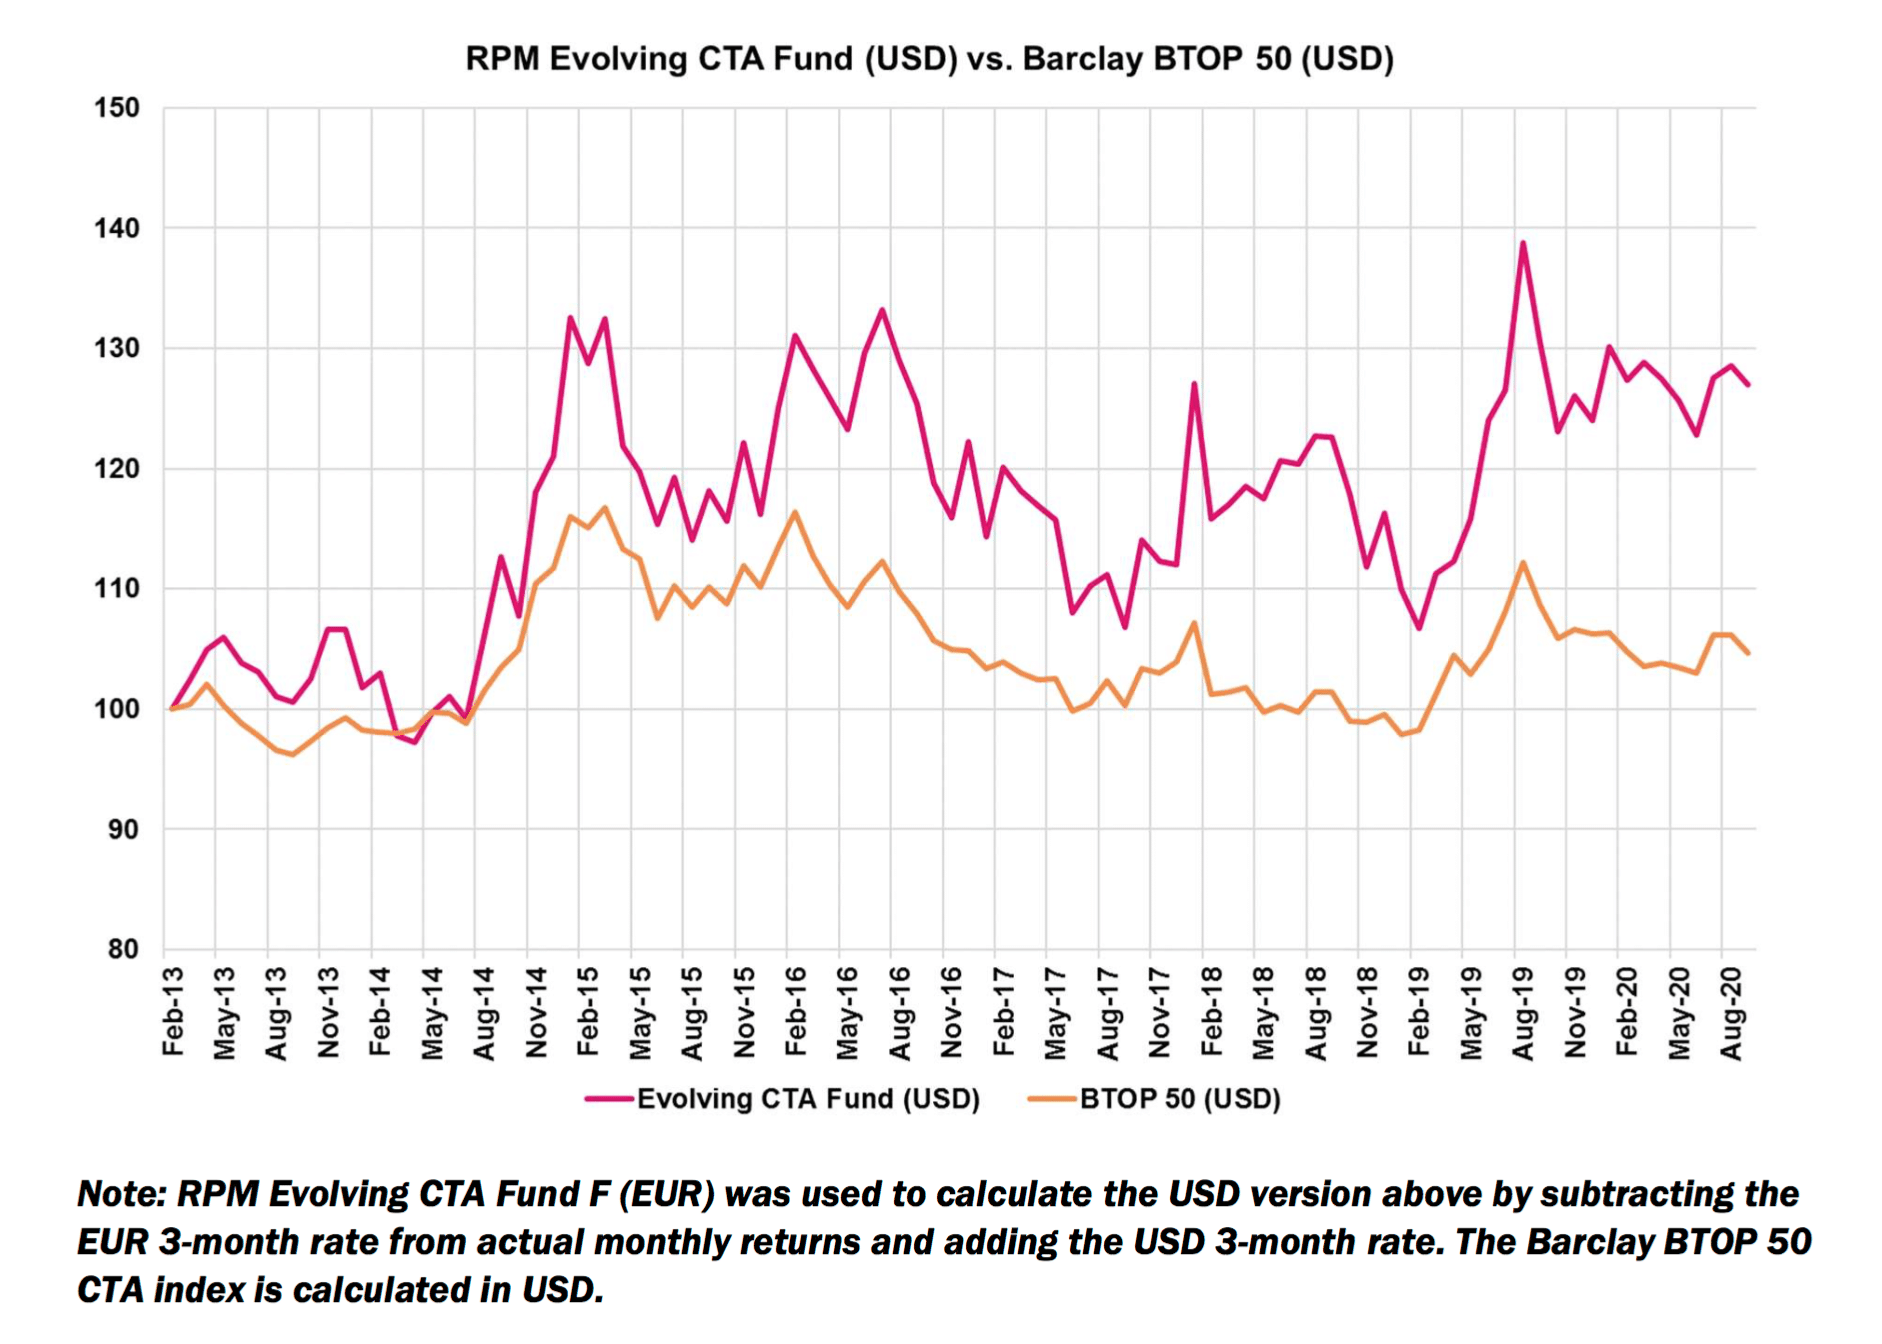
RPM Evolving CTA Fund
The Evolving CTA fund commenced trading in March 2013 and has thus only been active during one US election year: the surprise Trump victory in 2016. October 2016 was a difficult month also for Evolving, but the fund made 6.3% from the election day until year-end.
Overall, the Evolving fund has outperformed the benchmark index with approximately 3% p.a. in common currency terms, which was also the target set in 2013.
In a year when nothing seems ordinary, at least CTA returns have followed a familiar pattern so far. We hope and expect that this will continue into the fourth quarter.
Outlook
At the time of writing, the TSMOM/MDI reading is close to 1 standard deviation below its long-term average after having exhibited an erratic sideways to negative move since early August. This has been mostly negative for CTAs, and it signals an increased level of uncertainty and nervousness in markets. Looking forward, these periods often precede periods of strong TSMOM. An MDI reading below -1 standard deviation is – all other things ignored – a CTA buy signal.
The upcoming US election certainly accounts for some of the uncertainty. The narrative of a V-shaped recovery from the pandemic is still alive and well in the US and supported by incoming data. China seems to lift most, if not all, restrictions. The historical precedents, the recent market behaviour coupled with the upcoming closure of the Brexit mess and the US election, increase the probability of a CTA-friendly market environment during the rest of the year.
*Time Series Momentum (TSMOM) is a risk factor first identified by Moskowitz et. al. in 2011. RPM’s method of calculating TSMOM is called MDI and based on the ratio of absolute price move and volatility for a wide array of markets and timeframes. The long-term correlation of MDI and the performance of the SocGen CTA Index is 0.73, calculated on daily observations.
Written by Per Ivarsson and Mikael Stenbom of RPM Risk & Portfolio Management AB