By Daniel Ung, Kartik Chawla, and Jędrzej Miklaszewski – SPDR: The 2024 US presidential election is on the horizon, and investors are keen to gain insight into the election’s potential impact on the performance of US equity markets this year. While past performance cannot predict the future, history may be able to offer some insight. To that end, we analysed 100 years of equity return data using S&P1 indices, starting from August 1923, to assess the behaviour of equity market returns during election years.
The Impact of US Presidential Elections on US Equity Market Returns
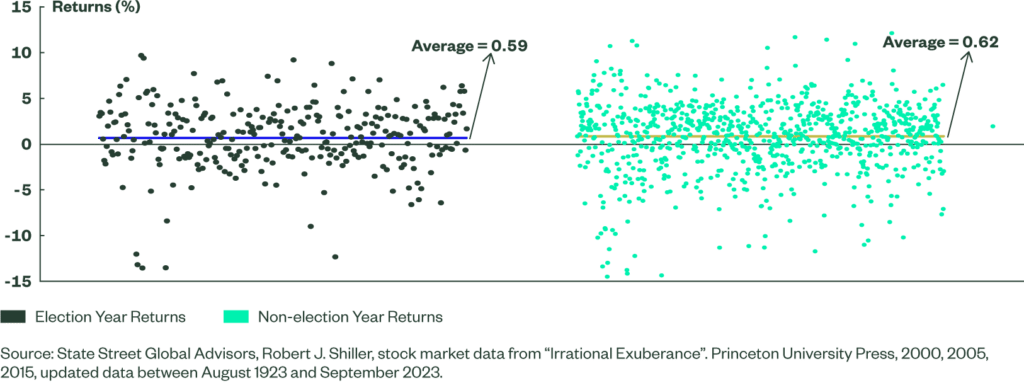
To start, we analysed the performance of the S&P during an election year, which we defined as the 12 months preceding the US presidential election, and compared that with returns during non-election years. Our analysis showed very little difference in the average performance of these two periods; the average return for election years was 0.59% versus 0.62% for non-election years, representing a differential of 0.03% every month, on average (Figure 1).
Paradoxically, when we looked at the monthly S&P return differential between election years and non-election years, we observed a positive outperformance of 0.18% per month in favour of election years. However, when we removed recession months — as defined by the National Bureau of Economic Research (NBER) — from our analysis, the difference shrank to a mere 0.05% per month.
Taken altogether, our research suggests that US equity returns during an election year are not meaningfully distinct from non-election year returns. That said, while there was little disparity in returns over the entire 100-year period, we did observe a more material level of outperformance (around 0.3%-1%) during two to three months of an election year (generally around July and August). Interestingly, this positive performance differential reversed after Election month i.e., the month in which elections took place (November).
Figure 1: Elections Historically Have Little Impact on Average Monthly Returns
How the Political Party in Charge Impacts US Equity Performance
To assess how the political party in charge has impacted equity markets, we analysed the dispersion of the return spread during election years and other years. Specifically, we examined whether the range of the return spread was historically more volatile depending on which political party was in charge of the presidency.
Interestingly, we noticed a wider return spread under Republican presidencies than under Democratic ones.
Historically, the range of return spread between election and non-election years was around 7.85% for Republicans, which is more than double the 3.07% witnessed under Democrats. This observation held true regardless of whether the recessionary periods, as defined by NBER, were removed from the analysis.
Also notable is that in the three months leading up to election month, often the performance of the S&P was positive but would invert after election month.
Economic Outlook Seems to Impact Return Volatility More Than Election
Next, we assessed the volatility of the S&P returns during election years and non-election years. During election years, often the S&P exhibited heightened levels of volatility. Over the entire 100-year period, the volatility of the S&P was 18.0% during election years, which is about 3.5% higher than during non-election years. However, when we removed recessionary periods from the analysis, the volatility of the S&P went down during election years by about 1.2%, mainly because many of those periods coincided with our definition of election years.
Once again, this suggests that volatility may be more driven by the economic outlook than by an imminent US election. When we scrutinised the volatility of the S&P under both Republican and Democratic presidencies, we did not see a consistent pattern of heightened or diminished volatility under either political party.
Does the Holding Period Matter?
While it is interesting to examine the average returns of the S&P around election time, most investors are likely to be more concerned with the holding period return, i.e., the return on an investment over a specific period while the investment is held in the portfolio.
We looked at three short-term holding periods: three months, six months, and 12 months before the election. The average holding return over each time period was 3.1%, 3.9%, and 7.1%, respectively. That implies that the last three months contributed most to the 12-month holding return, on average. Said differently, investors who had exposure to the S&P for the three months preceding the US presidential election saw the highest level of compounded quarterly return prior to election month.
To complement our previous returns analysis, we also examined the net investment fund flows into US equities during election years. We did so by analysing the net inflows of open-ended US equity funds, which are the net investor inflows excluding price performance. For the period beginning January 1993 and ending September 2023, we compared net inflows during election years and non-election years.
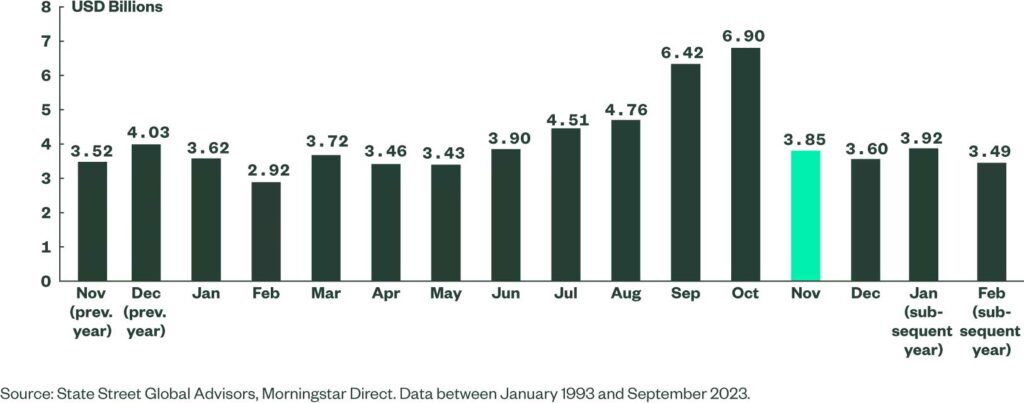
What we observed is that there seemed to be higher average inflows in the 12 months prior to election month, by approximately USD$3.5B on a median basis, as compared to the same period in other years. Inflows seemed to see a significant pickup around six months prior to the election date and steadily increased up to election month but dipped thereafter, even though they remained positive overall (Figure 2).
Figure 2: US Equity Inflows Historically Increase ~Six Months Prior to Election Month
How Economic Conditions Impact Stock Market Performance in Election Years
From our analysis of the performance of the S&P during election and non-election years, we generally found that the performance was inconsequential, especially when we removed NBER recessionary periods from the analysis. We then turned our attention to the performance of the S&P during election years and, in particular, how the economic conditions are linked to the stock market performance.
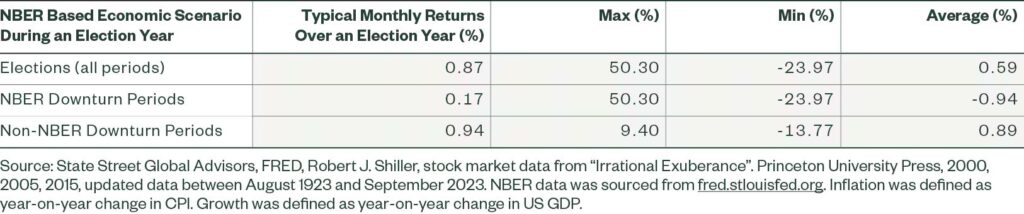
Our analysis shows that the average monthly S&P return in election years was 0.9% per month when there was no NBER recession. However, when an NBER downturn occurred, the return dropped substantially to 0.17% on a median basis, and -0.94% per month on an average basis as a result of a few outliers skewing the data.
What this means is that economic conditions appear more relevant than US presidential elections alone, to potentially presage the performance of the S&P (Figure 3).
Figure 3: Performance of the S&P During an Election Year
How Different Economic Regimes Impact Equity Performance
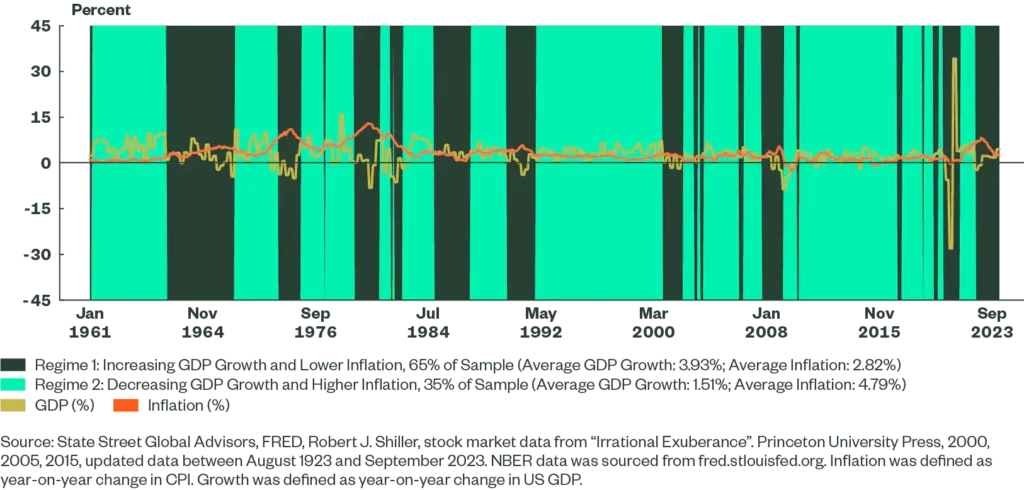
To further understand how equity performance might be linked to the economic conditions during election years, we examined the S&P’s performance under different economic regimes starting from 1961, determined using a Hidden Markov Model based on inflation and GDP growth. A hidden Markov model is a statistical technique that aims to model underlying regimes that are not directly observable, but can be inferred from observed data.
For this analysis, we chose to use a two-state regime: (1) an increasing GDP growth, low inflation regime and (2) a decreasing GDP growth, high inflation regime. As of December 2023, we are in the latter regime (Figure 4).
Figure 4: Two-state Hidden Markov Regime of Inflation and GDP Growth
To understand the typical performance of the S&P during the election year, we chose to focus on median return figures to avoid distortions from a few return outliers. We found that the S&P generally produced a monthly return of 0.87% per month up to the election month. In periods where a benign economic environment prevailed, or where GDP growth rose and inflation was low, the monthly return was 1.02% per month. And in periods of a more challenging environment, the monthly return oscillated at 0.36%. The spread in performance was 0.66% and both were positive in absolute terms.
With respect to S&P performance during different presidencies, we observed a much wider spread between a strong and weak economic environment under a Republican presidency than under a Democratic presidency. The observed spread under a Democratic presidency was 44 basis points (bps), but that significantly widened to 366 bps under a Republican presidency.
How Three Months of Recession Impact S&P Returns in Election Years
Since typically we only find out about the beginning and end dates of NBER recession periods after the recession has occurred, we analysed S&P returns following NBER recession periods during election years. Specifically, we looked at what the average return of the S&P was if investors had decided to go long on US equities after three consecutive months of an NBER recession during the election years, and we tracked the return from that point up until the election month.
Unsurprisingly, when there was no recession, the return was 0.87% on a median basis and ranged between -13.8% and 9.4%. Conversely, when there were three consecutive months of NBER recession, the return was much lower at 0.45% on a median basis and ranged between -24.0% and 50.3%. In other words, even during months that coincided with NBER recessions, the return of the S&P was typically positive in election years, even if a few extremely negative return outliers had been observed during this period.
This suggests investors in the current regime may want to stay invested in the S&P, especially if they believe the chances are low that NBER would declare a recession between now and November 2024.
The article was originally published here.
Footnote
1 S&P equity data is based on the S&P Composite Index from 1923 to 1928, the S&P 90 Index from 1928 to 1957, and the S&P 500 Index from 1957 to 2023.
Glossary
National Bureau of Economic Research (NBER)
A private, non-profit, non-partisan group that conducts economic research and disseminates findings among academics, public policy makers, and business professionals. Key focus areas include developing new statistical measurements, estimating quantitative models of economic behaviour, and analysing effects of public policies.
Recession
As defined by NBER, the period between a peak of economic activity and its subsequent trough, or lowest point. It involves a significant decline in economic activity spread across the economy, lasting more than a few months.
Volatility
A statistical measure of the dispersion of returns for a given security or market index.
Disclosure
Information Classification: General Access
Marketing Communication
State Street Global Advisors Worldwide Entities
Important Information
The whole or any part of this work may not be reproduced, copied or transmitted or any of its contents disclosed to third parties without State Street Global Advisors’ express written consent.
The views expressed in this material are the views of the Quantitative Research & Analysis Team through the period ended 12 February 2024 and are subject to change based on market and other conditions.
This document contains certain statements that may be deemed forward looking statements. Please note that any such statements are not guarantees of any future performance and actual results or developments may differ materially from those projected.
The information provided does not constitute investment advice and it should not be relied on as such. It should not be considered a solicitation to buy or an offer to sell a security. It does not take into account any investor’s particular investment objectives, strategies, tax status or investment horizon. You should consult your tax and financial advisor.
All information is from State Street Global Advisors unless otherwise noted and has been obtained from sources believed to be reliable, but its accuracy is not guaranteed. There is no representation or warranty as to the current accuracy, reliability or completeness of, nor liability for, decisions based on such information and it should not be relied on as such.
Past performance is not a reliable indicator of future performance.
Investing involves risk including the risk of loss of principal.
The trademarks and service marks referenced herein are the property of their respective owners. Third party data providers make no warranties or representations of any kind relating to the accuracy, completeness or timeliness of the data and have no liability for damages of any kind relating to the use of such data.
Equity securities may fluctuate in value and can decline significantly in response to the activities of individual companies and general market and economic conditions.
The information provided does not constitute investment advice as such term is defined under the Markets in Financial Instruments Directive (2014/65/EU) or applicable Swiss regulation and it should not be relied on as such. It should not be considered a solicitation to buy or an offer to sell any investment. It does not take into account any investor’s or potential investor’s particular investment objectives, strategies, tax status, risk appetite or investment horizon. If you require investment advice you should consult your tax and financial or other professional advisor.
The S&P 500® Index is a product of S&P Dow Jones Indices LLC or its affiliates (“S&P DJI”) and have been licensed for use by State Street Global Advisors. S&P®, SPDR®, S&P 500®, US 500 and the 500 are trademarks of Standard & Poor’s Financial Services LLC (“S&P”); Dow Jones® is a registered trademark of Dow Jones Trademark Holdings LLC (“Dow Jones”) and has been licensed for use by S&P Dow Jones Indices; and these trademarks have been licensed for use by S&P DJI and sublicensed for certain purposes by State Street Global Advisors. The fund is not sponsored, endorsed, sold or promoted by S&P DJI, Dow Jones, S&P, their respective affiliates, and none of such parties make any representation regarding the advisability of investing in such product(s) nor do they have any liability for any errors, omissions, or interruptions of these indices.
6386846.2.1.GBL.RTL
Expiry Date: 28 February 2025
© 2024 State Street Corporation – All rights reserved