Copenhagen – (Jesper Rangvid): Inflation in the US is falling fast, but when volatile energy and food prices are factored out, core inflation is still far too high at 5 percent. As a result, the Fed continues to raise interest rates, increasing the likelihood of a recession. But is core inflation really that high? If inflation in the US were measured as in the euro area, it would be only 2 percent. There would be no reason to tighten monetary policy further. The difference arises from so-called “shelter costs”, which reflect the consumption value of homes. However, these costs cannot be observed in real life, which means that the Fed is struggling with an imputed price. Another result is that Europe is fighting a harder battle against inflation than the US.
Fed’s preferred measure of inflation, personal consumption expenditure (PCE) inflation, peaked at seven percent in the autumn of 2022. Since then, it has fallen steadily, reaching three percent in June. This is close to the Fed’s inflation target of two percent. Nevertheless, at its last meeting on 25-26 July, Fed raised the monetary policy rate because core inflation – i.e. headline inflation minus energy and food inflation – remains too high.
Fed Chair Powell said (link): “But you know, we need to see that inflation is durably down that far, you know, as you know, we think and most economists think that core inflation is actually a better signal of where headline inflation is going, because headline inflation is affected greatly by volatile energy and food prices, so we would want core inflation to be coming down because that’s what we think, that’s, core is signaling where headline’s going to go in the future. And core inflation is still pretty elevated, you know?”
But is core inflation in the US really “still pretty elevated”? Given the way inflation is measured in the US, core inflation is too high, but inflation can be measured in several meaningful ways. For example, if inflation in the US were measured the way it is measured in Europe, core inflation in the US would already be two percent. Fed’s job would then be done and it would not have to raise interest rates any further.
US inflation measured the way Europeans measure inflation
In the US there are two official measures of inflation: PCE inflation (Personal Consumption Expenditure, published by the Bureau of Economic Analysis, BEA) and CPI inflation (Consumer Price Index, published by the Bureau of Labor Statistics, BLS). Let us note this for now and come back to the differences between the two later.
In 2006, the Bureau of Labor Statistics (BLS) introduced a measure of inflation in the US that can be compared to inflation in the European Union (link). Inflation in Europe is based on the Harmonised Index of Consumer Prices. Accordingly, BLS introduced a Harmonised Index of Consumer Prices for the US (US HICP).
There are two main differences between the US CPI and the US HICP. First, the US CPI estimates price changes for the non-institutional urban population, whereas the European HICP estimates price changes for the whole population, i.e. both rural and urban. The US HICP thus extends the coverage of the US CPI by including the rural population. Secondly, and more importantly, the US CPI includes the cost of owner-occupied housing, which is not the case in the European HICP. Therefore, to create a US HICP, the cost of owner-occupied housing was removed from the US CPI. BLS briefly summarises: “To construct the experimental U.S. HICP, the CPI first was expanded to cover the entire (noninstitutional) U.S. population and then was narrowed to remove the owner-occupied housing costs that the HICP excludes from its scope.” The BLS makes the resulting series for both headline and core inflation available on its website (link).
Figure 1 shows the three core inflation series for the US: PCE core inflation, CPI core inflation and HICP core inflation.
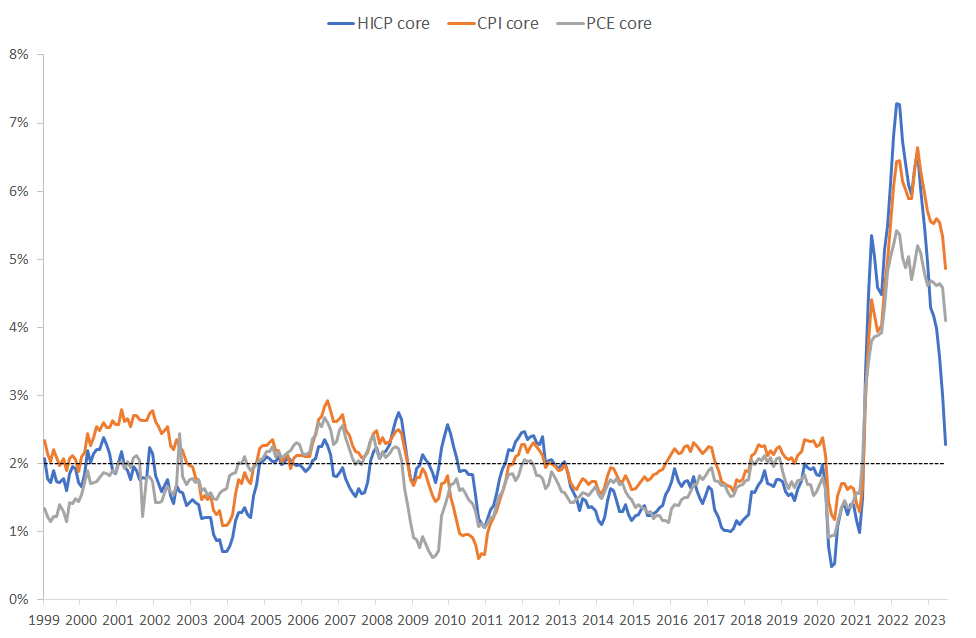
Data source: FRED St. Louis Fed database and BLS webpage.
Over time, the three series behave broadly similarly. They fluctuated around two percent before the pandemic, skyrocketed after the pandemic and have been declining since autumn 2022.
At present, however, there are significant differences. In June 2023, the last observation, CPI core inflation was 4.9 percent, PCE core inflation was 4.1 percent and HICP core inflation was 2.3 percent. So while both PCE and CPI core inflation rates are much too high – at more than four percent, – HICP core inflation is very close to Fed’s inflation target of two percent.
In other words, and this is the most important message here, if the US calculated inflation the way Europeans do, US inflation would hit the target. The Fed could relax and there would be no need to tighten monetary policy further. The Fed could claim “victory”.
On the other hand, when Fed focuses on CPI and PCE core inflation rates, inflation is “still pretty elevated”, and monetary policy may need to be tightened further, increasing the risk of recession.
Which inflation measure should the Fed follow then? And what are the differences?
Why is US CPI inflation so much higher than HICP inflation?
The main difference between US CPI and US HICP inflation rates is that the HICP includes the cost of owner-occupied housing, sometimes referred to as the “cost of shelter”, which is not included in European measures of inflation, and thus not included in the US HICP.
Figure 2 illustrates how rising shelter costs have recently pushed up US CPI core inflation. The figure compares the difference between HICP and CPI inflation rates with shelter inflation. The correlation is high. The current historically high rate of shelter inflation leads to a historically large difference between CPI and HICP core inflation rates in the US. In other words, Fed is fighting a too high core inflation because shelter inflation is too high. If shelter inflation were removed – as is the case in Europe – there would be no more fights.
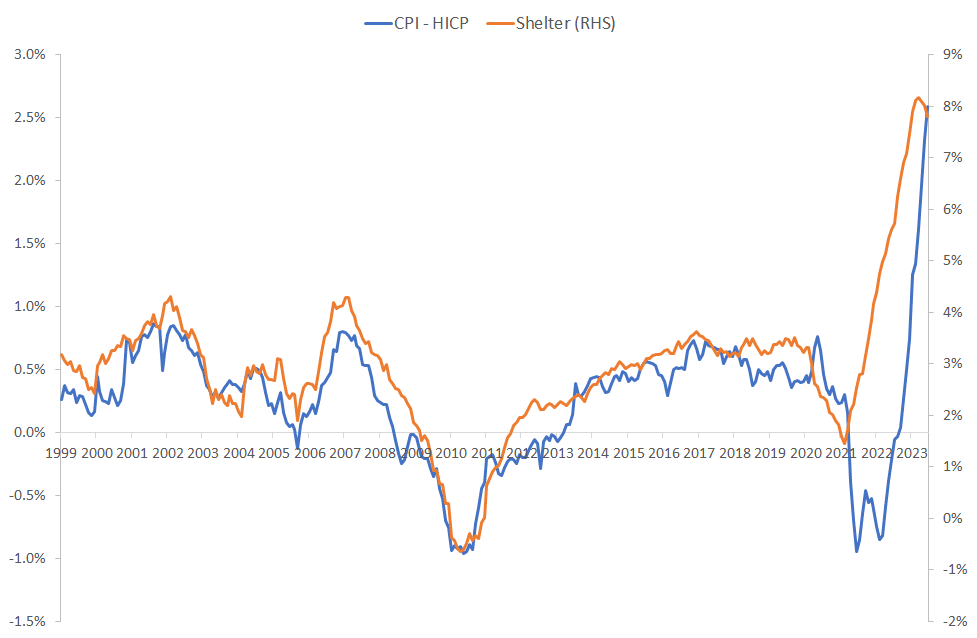
Data source: FRED St. Louis Fed database and BLS webpage.
What is shelter inflation?
Shelter inflation consists of two parts: (i) the rent that tenants pay, and (ii) a hypothetical price that owners of a home would have to pay if they had to rent their home instead of owning it. While the first part (rent) is uncontroversial, the second part is not. We can see rent in the data because we can see what tenants pay. We can include that in the price index. However, we cannot see what a homeowner would have to pay if she does not own the home she lives in but had to rent it.
The tricky thing about homes is that buying a home is both a financial investment and a consumption expenditure. If you buy a home today and sell it later, you have a gain or a loss. That is the financial investment part, i.e. the change in the value of the home. This should not be included in the consumer price index. Instead, you should include the change in the consumption value of the home – the shelter service it provides – in the consumer price index. However, you cannot see this value, you have to estimate/impute it. This estimate is called “Owners’ equivalent rent of residences (OER)”.
The equivalent rent of residences is therefore not an observable price. It is an estimated/imputed price based on a survey. The BLS asks a representative sample of homeowners (about 50,000) how much they think they might pay for rent. The typical question would be: “If someone were to rent your home today, how much do you think it would rent for?”. Here (link) is the link to the detailed description of how the BLS measures these things, and here is a simpler explanation (link).
As already shown in Figure 2, shelter inflation is currently very important for inflation in the US CPI. Shelter accounts for 34.4 percent of CPI. Of this, rents account for 7.5 percent and OER for 25.4 percent.
Treatment of owner-occupied housing costs in Europe
Theoretically, it is correct to include the consumption value of a home in the consumer price index. If it costs more to rent a home, the cost of this part of our overall consumption has increased, and a consumer price index should – in theory – reflect this. Why then do Europeans leave out this important part of consumption when calculating their consumer price index?
For many years there has been a debate about whether and how the consumption value of housing should be included in European consumer prices. Also, the ECB argues in its recent monetary policy strategy review that the inclusion of owner-occupied housing would make inflation more representative. However, the inclusion of owner-occupied housing costs in national CPIs varies widely across EU countries and the EU has failed to bridge these differences. EU countries simply cannot agree on a common method to calculate imputed costs for owner-occupied housing. This of course also underlines that it is not easy to calculate these costs.
Nevertheless, ECB would like to see these costs included in the inflation measure for the euro zone. In this analysis (link), ECB notes that inflation since 2014 would be 0.1-0.3 percent higher than the inflation measure currently used if owner-occupied housing costs were included.
Comparison of inflation challenges in the US and Europe
CPI Core inflation was 4.9 percent in the US in June 2023. This is largely due to the rising cost of shelter, as mentioned. Excluding shelter costs, HICP core inflation was 2.3 percent in June.
In the euro area, core inflation was 6.8 percent in June (this is CPI inflation excluding food and energy. If tobacco and alcohol are also excluded, core inflation was 5.4 percent). This means that the comparable core inflation rates in the euro area and the US are 2.3 percent and 6.8 percent respectively. The inflation problem is clearly much bigger in Europe.
Finally, for the sake of completeness: US PCE vs. US CPI
Most of the discussion here has been about CPIs, since we can compare these in the US and in Europe. However, in the US there is another important official inflation series, the PCE inflation rate. In fact, this is the one to which the Fed traditionally attaches the greatest importance. For the sake of completeness, let me briefly describe the main differences between the CPI and the PCE inflation rates.
To calculate a price index, one needs the prices of the individual goods and services and the weights assigned to the individual prices. The weights reflect the importance of the different goods and services in the consumption basket of a typical consumer.
You can see what households bought. You can also see what businesses sold to households. This is essentially the difference between the CPI and the PCE. The US CPI is based on a survey of what households buy. The US PCE is based on a survey of what businesses sell.
The different procedures for calculating PCE and CPI inflation lead to different weightings of the individual consumer goods in the two indices. These different weightings account for most of the difference between CPI and the PCE, this Fed note explains (link). Shelter also comes into play here, as there are significant differences in the weighting of shelter. As mentioned earlier, shelter accounts for more than 30 percent of CPI but less than 20 percent of PCE (link).
This difference in weighting also explains the current difference between PCE and CPI core inflation. Core PCE inflation was 4.1 percent in June and CPI core inflation was 4.9 percent. Given the high rates of shelter inflation, as shown in Figure 2, it is not surprising that CPI core inflation (4.9 percent), where shelter inflation plays a larger role, is higher than PCE core inflation (4.1 percent).
Conclusion
Core inflation in the US is considered too high. This is largely due to the rising cost of shelter. These are housing costs that are not observable in real life but must be imputed. Due to uncertainties in the methods used to calculate shelter costs, European inflation indices do not take these costs into account. If the same approach were taken in the US, i.e. not taking into account shelter costs, core inflation in the US would be two percent. With core inflation at two percent, the Fed could relax.
This post has originally been published here.