

By Patrick Carlevato – SEI: Explore best practices to help LPs extract meaningful insights from the mass of private equity portfolio company data.
When a well-known tech-focused hedge fund shared that it marked down the value of its investments in private companies by about 33% across its VC funds in 2022, it delivered a treasure trove of information to its LPs—at least to the LPs positioned to utilize this information. The announcement of such a large markdown presents an opportunity for us to examine how LPs can extract the most accurate and actionable insights from manager data.
Portfolio Company Data
Private equity performance metrics have their drawbacks, but private fund managers do share tremendous transparency with their managers in quarterly updates—providing details on each portfolio company. The increasing number of private investment lines in the portfolio is a challenge for LPs, as it requires sifting through PDFs to extract the most meaningful information. When applied across a portfolio of private investments, it is onerous to structure data on each portfolio company to answer purposeful questions about the portfolio.
Let’s look at a fictitious portfolio with 100 private investments. This portfolio has more than 1000 underlying portfolio companies. Each quarterly financial update includes data points on sector, geography, valuation, revenue, EBITDA, employees, and additional nuanced details for each portfolio company. Please introduce me to the LP that has the time to key these thousands of data fields into an Excel spreadsheet.
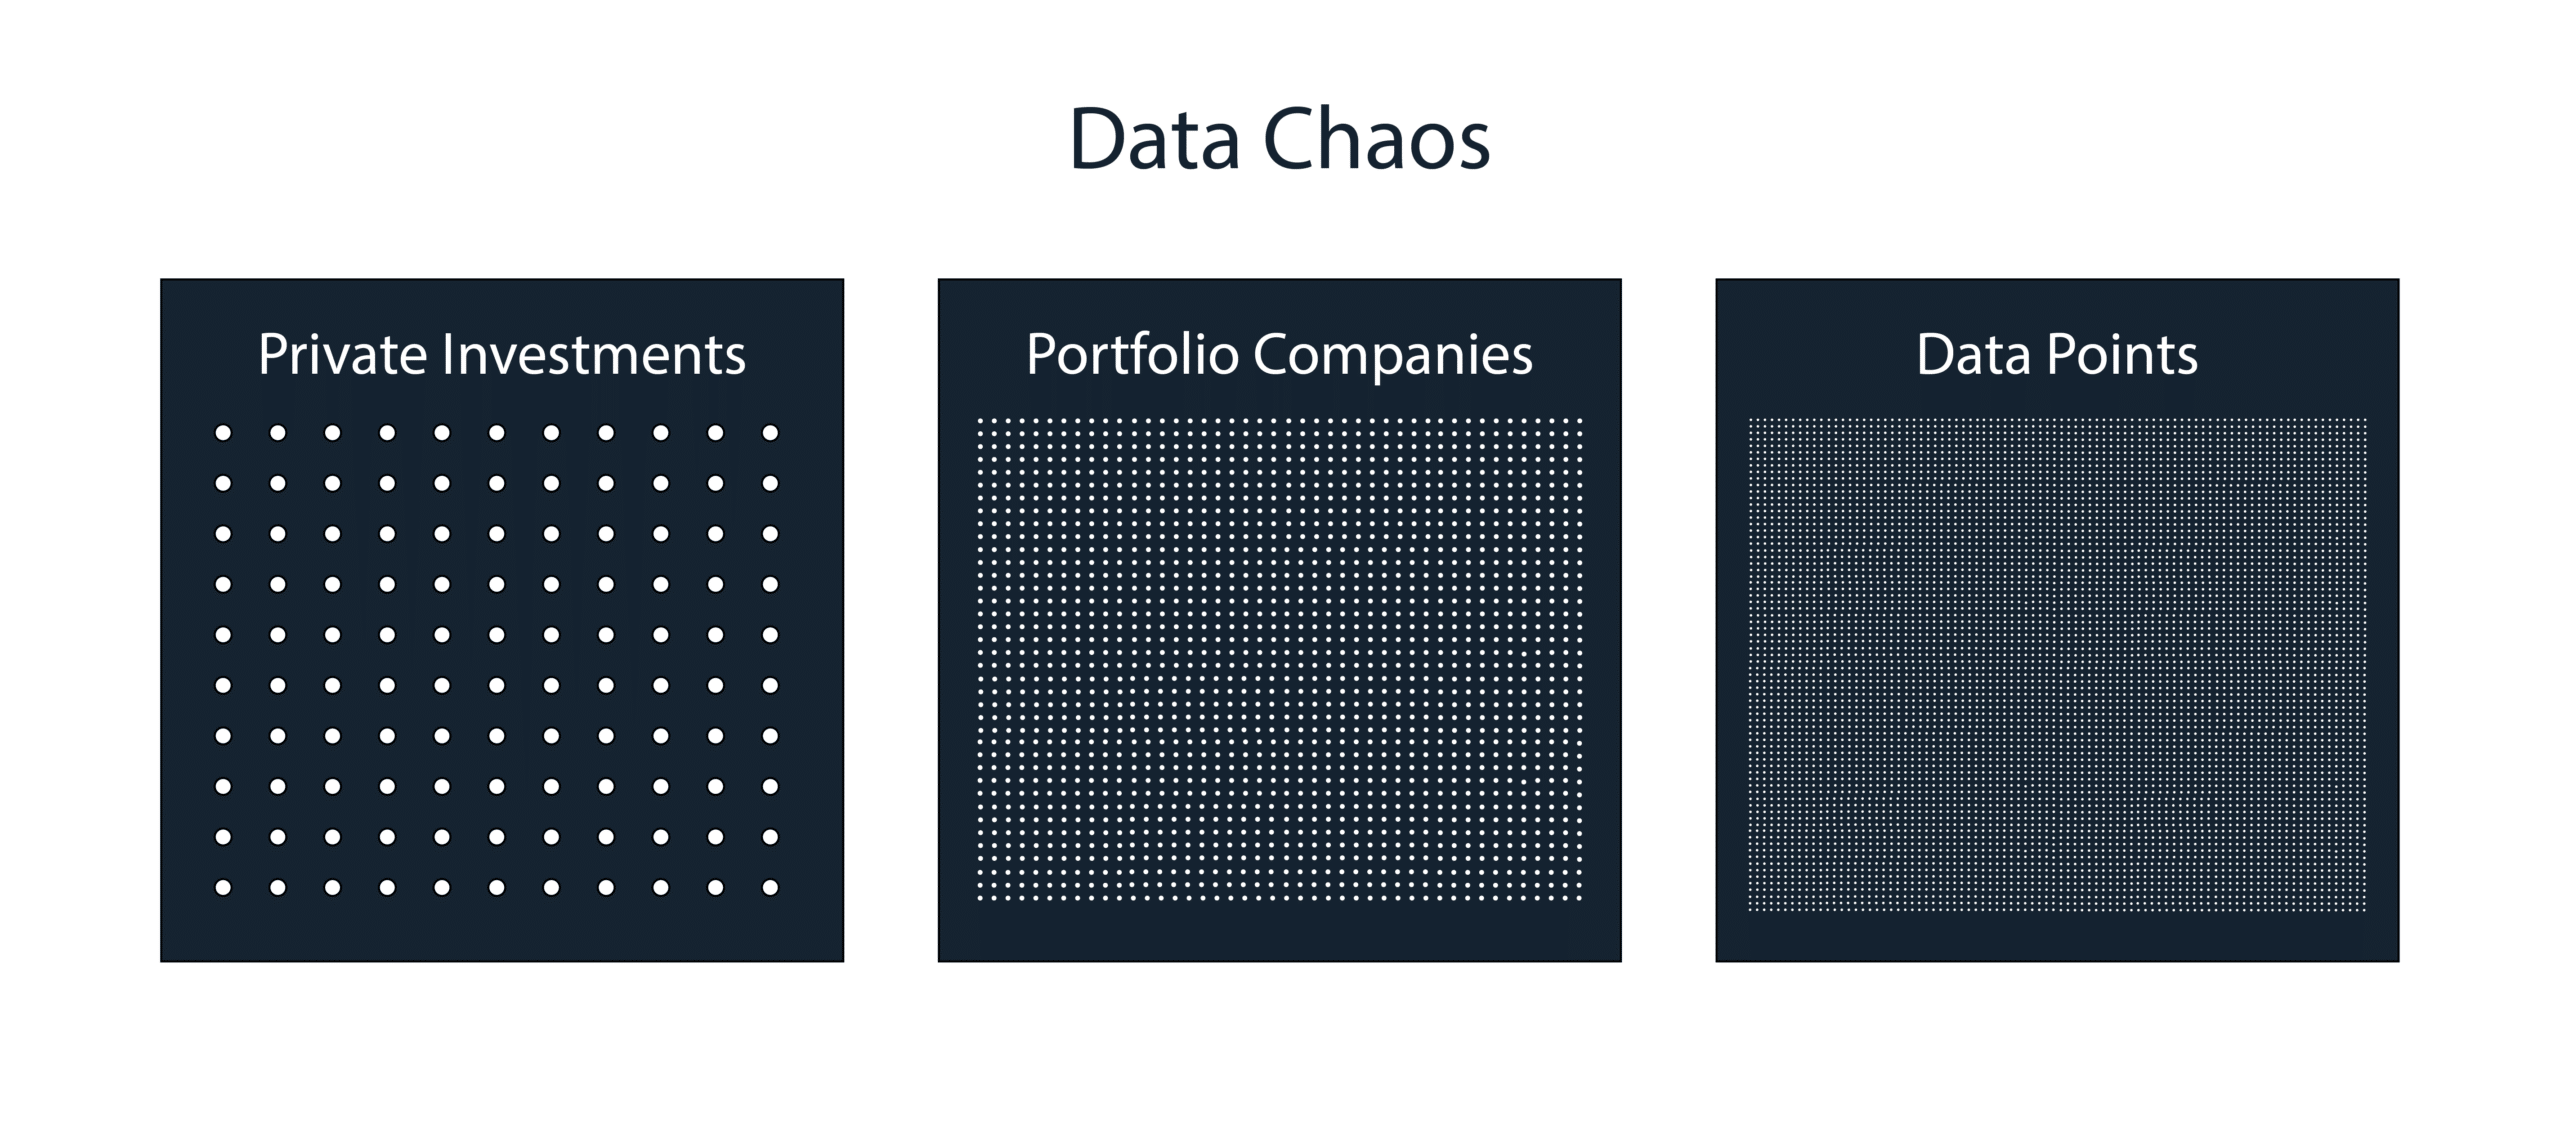
Without that data in a structured format, it is tedious for LPs to isolate true exposure to specific sectors or geographies. However, when that data is structured and part of a robust analytics system, the LP can begin to apply in mass the insights from valuations when a manager shares its quarterly update to similarly categorized portfolio companies across all of its managers. Instead of applying a blanket 33% haircut to its entire venture book, the LP can look at the size of the haircut for specific sectors within the manager’s portfolio and apply that haircut to its exposure to that sector in the rest of its venture portfolio. Whoa—a manager might be able to make a reasonable estimate for the markdown across its venture portfolio and better understand current exposures.
Look-Through Transparency
For an LP with heavy alternatives exposure to both private equity and hedge funds, it is particularly tricky to understand exposures by sector or geography. There is heavy data work involved and each manager may provide varying depths of transparency or may use any of a number of industry classifications. For example, a hedge fund manager may share exposures by sector and industry plus its top 10 positions—all the while, masking the names of its short positions. Meanwhile, a health care focused private equity manager will provide narrow industry definitions that make it hard to roll up exposures across all managers.
Through a harmonization process, any exposure that acts like Health Care will be categorized as Health Care, so that exposure can be rolled up across all managers to determine the total portfolio’s exposure to Health Care. This process solves the challenge created when some managers use proprietary industry classifications while others use S&P GICS or Bloomberg.
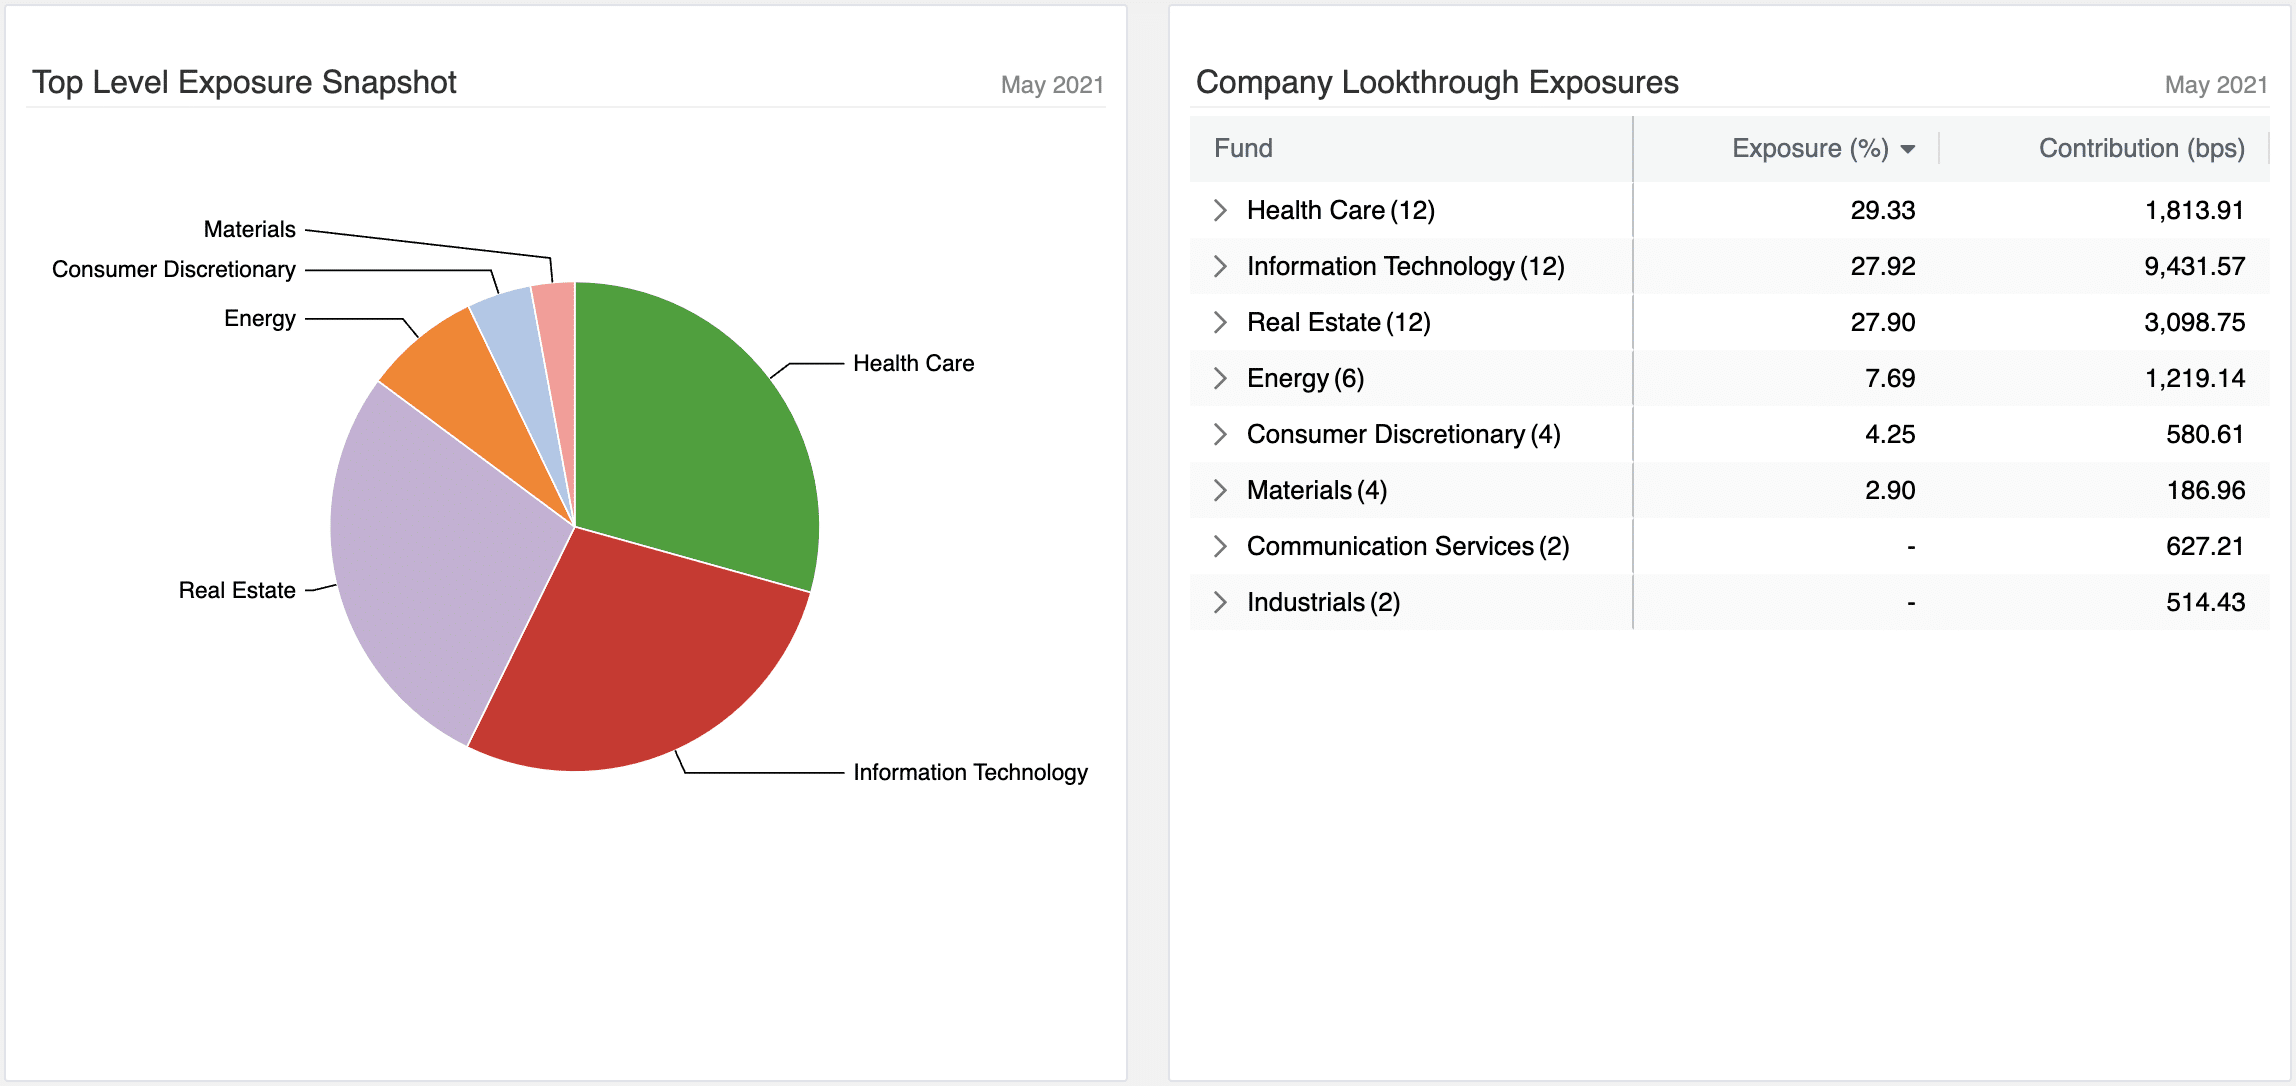
The idea of Look-Through Transparency allows an LP to roll up the portfolio to meaningful categories like Asset Class, Strategy, Sector, Geography, Size, etc., and then drill into any of those categories to see the underlying fund(s), positions, or portfolio companies. To do this efficiently, managers need to deliberately structure essential meta-data for each portfolio company and the exposure data from every hedge fund fact sheet as well as systematically apply multiple tags to every investment in its portfolio. A reliable service provider, such as SEI Novus, can efficiently and methodically manage this process for you, so that your team can focus on gleaning insights from the data to make better investment decisions.
PortCo Performance with SEI Novus
Here at SEI Novus, we provide investment offices with a structured, aggregated, and accessible viewport into their private investment program. Manage exposures, explore portfolio company details, construct valuation bridges, and more. Watch a product tour now, or connect with a member of our team.
