Copenhagen – (Jesper Rangvid): There are striking similarities between US inflation developments today and in the early 1970s. If inflation continues to develop as it did back then, inflation should be normalized in one and a half years, that is in the summer of 2024. I doubt this will happen, though, because inflationary pressures are more widespread today. Consequently, the Fed should keep interest rates elevated for at least another year.
US inflation determines the Fed’s interest rate policy, which in turn influences global financial markets. In short, stocks, bonds, and other financial assets, in the US and around the world, depend on US inflation.
US inflation has been extremely high during 2022 but peaked at 9% in June and has been falling ever since. The question is whether it will continue to fall, i.e., whether the Fed can relax? If so, this would be positive news for risky assets.
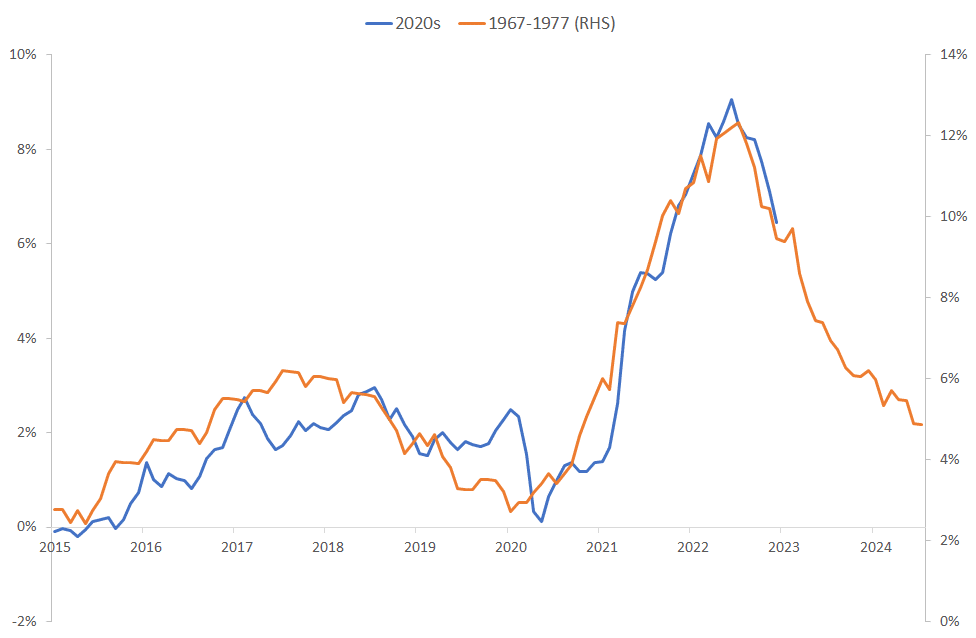
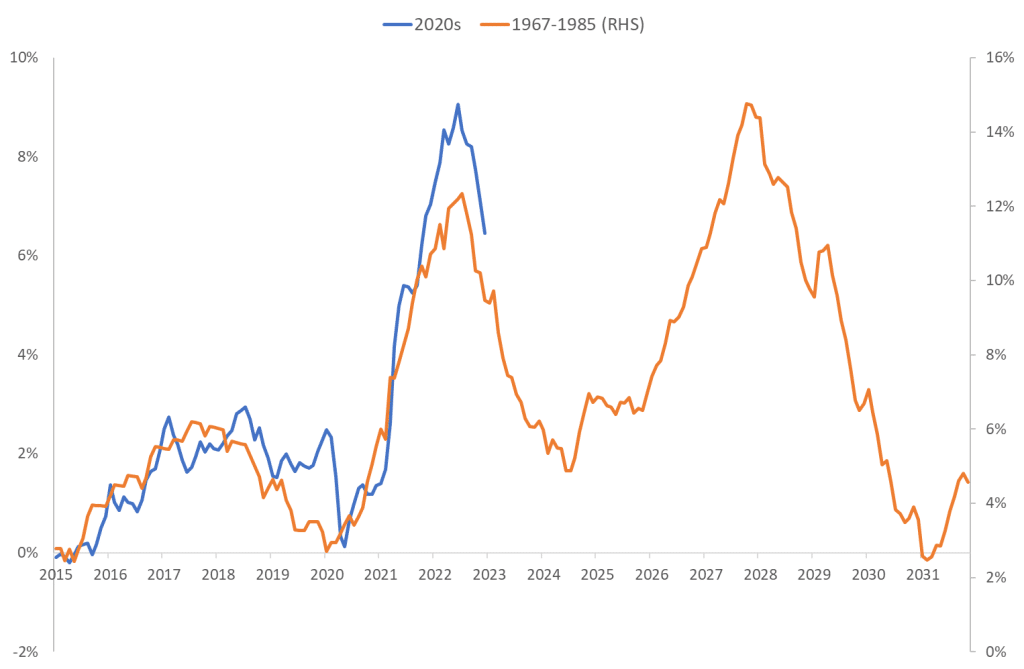
In this analysis, I study similarities and differences to the 1970s. Figure 1 shows the development in US inflation from 2015 and onwards, overlayed with inflation from 1967 to 1977. The figure reveals that inflation developments today are strikingly like the inflation developments of the early 1970s.
Data source: FRED of St. Louis Fed.
A few things stand out:
- Between 2015 and 2020 inflation fluctuated within a narrow band (0%-2%) with no strong trend, like inflation fluctuated within a narrow band (3%-6%) with no strong trend between 1967 and 1972.
- Early 2021, respectively late 1972, inflation started rising.
- The speed with which inflation rose (the slope of the inflation curve) during the two periods is basically the same.
- The duration of the increase is also the same: it took two years before inflation peaked in the early 1970s (it rose from late 1972 until late 1974), like it took two years this time around, from its low in May 2020 to its peak in June 2022.
- Inflation has been consistently falling since June 2022, like it consistently fell after the peak in late 1974.
Overall, inflation movements during the two periods are highly correlated. The correlation is 0.95!
The underlying reasons why inflation rose are also correlated. In the early 1970s inflation rose because of supply-chain challenges, related to the supply of oil, but also because of an expansionary fiscal policy related to the Vietnam war and too loose monetary policy; I explained in this analysis (link) why inflation rose in the 1970s. Oil-producing countries cut the supply of oil, oil prices rose, and broad-based inflation followed as firms raised prices to cover costs and workers demanded higher wages, leading to further price increases.
This time around supply-chain challenges contributed to inflation too. Supply-chain challenges were not the main culprit, though, as I argued here (link). It was the pandemic, and the consequences this had. In response to the pandemic, policy makers introduced too expansionary fiscal and monetary policies, pushing up demand. When demand is high and supply chains are challenged, the result is obvious: Inflation.
So, the underlying reasons are correlated, even if not perfectly so, and the inflation processes are correlated, as Figure 1 shows. Can we use the experiences from the 1970s to say what will happen from here?
When will inflation normalize?
Based on Figure 1, it is tempting to predict that inflation will be back on target (2%) in one and a half year, that is in the summer of 2024.
Will inflation normalize in mid-2024?
The prediction that inflation normalizes in mid-2024 is based on a simple projection of the inflation path of the 1970s. It is tempting, given the similarities between inflation back then and now, but it is also risky. There are two main risks.
The first relates to the monetary-policy mistake in the early phase of this inflationary period. Monetary policymakers argued for too long that inflation was temporary and, as a result, waited for too long before monetary policy was tightened. It remains a mystery – and a policy mistake – why they did so. No matter the reason, the fact is that monetary was too slow to react.
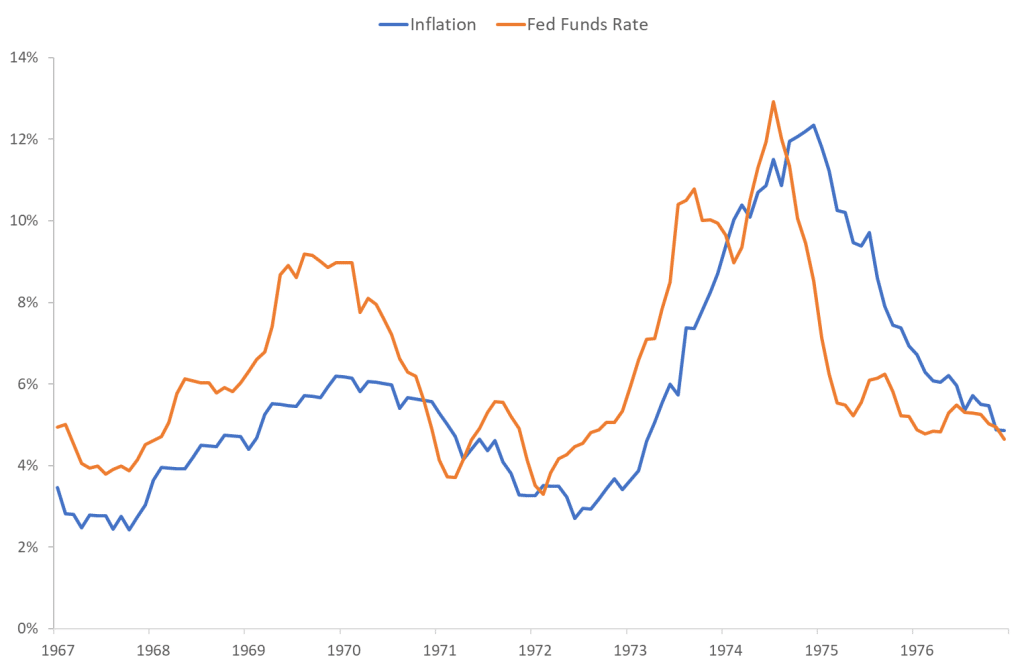
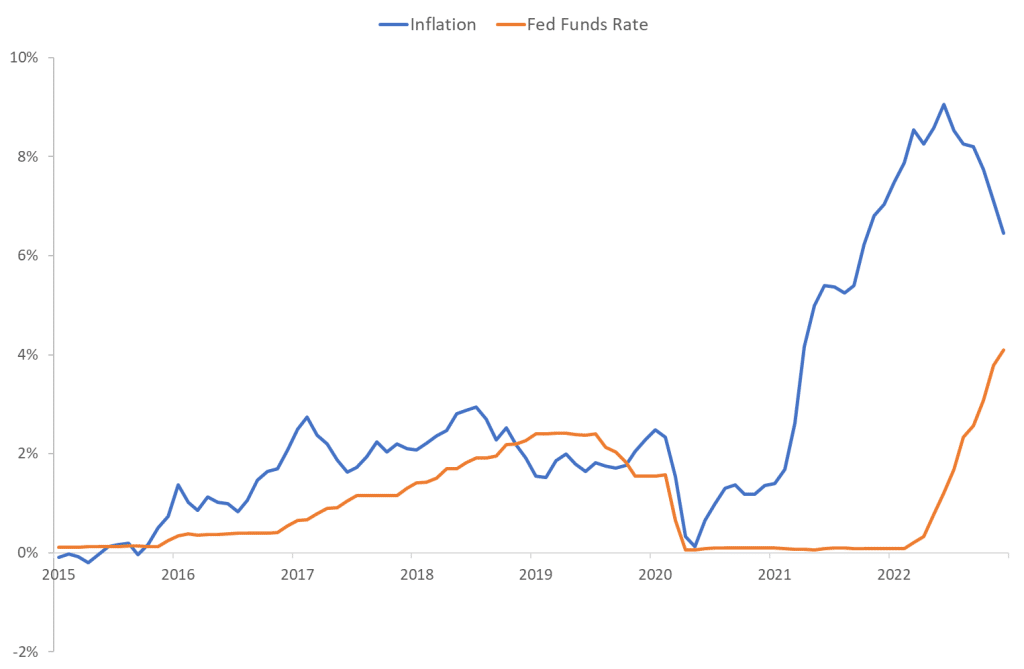
To illustrate this, compare Figure 2 that shows US inflation and the Fed Funds Rate during the early 1970s to Figure 3 that shows those same variables during the past couple of years.
As I argued here (link), US monetary policy reacted fast in the early 1970s. As inflation started rising the monetary policy rate was hiked almost immediately, as Figure 2 reveals. It may even be argued that the Fed was ahead of the curve, as the Fed Funds Rate was hiked a few months before inflation took off. We can discuss whether the Fed Funds Rate was hiked enough and whether it remained elevated for long enough, as I will do below (it was not), but the Fed at least got the timing right in the early 1970s.
Data source: FRED of St. Louis Fed.
Compare this to developments during the past few years, as shown in Figure 3. Despite the rise in inflation during 2020 and 2021, the Fed Funds Rate was kept at 0%. When the Fed started raising rates in March 2022, inflation was already running at a red hot 8%!
Data source: FRED of St. Louis Fed.
We can debate whether rates must be raised as much as inflation – probably not because inflation expectations are better anchored than in the 1970s – but passively letting inflation rise to 8% was not good.
Two problems follow from this late reaction: The risk of monetary-policy miscalibration and the risk of inflation becoming broad based and difficult to combat.
With respect to the first, we must wait and see. Whether the Fed ends up raising rates too fast, to make up for the late start, and/or too much, is too early to tell. But the risk that policy will be miscalibrated is higher when the policy intervention is delayed.
With respect to the second, that inflation becomes more difficult to combat, there are already signs this will be the case.
Given that energy and food prices were increasing in the early 1970s and today, they accounted for a significant part of the rise of inflation. Similarly, energy prices have been falling during the past months, dragging down headline inflation. The same happened in the 1970s.
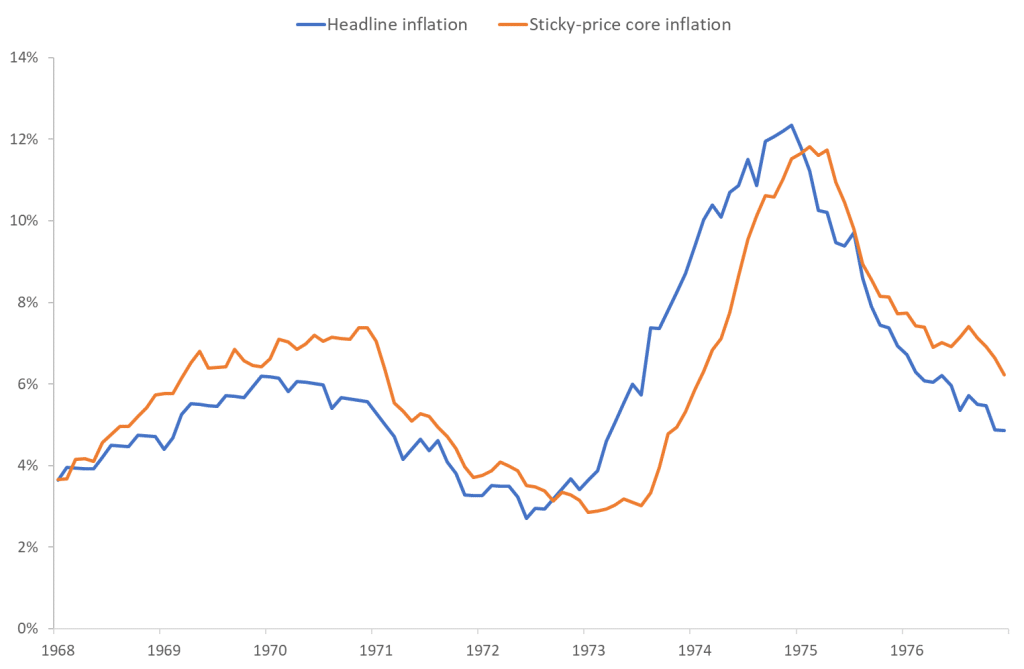
In the 1970s, however, other prices fell as well as energy prices cooled down. In other words, both headline inflation and core inflation fell when energy prices cooled down.
Core inflation equals headline inflation minus energy and food-price inflation, i.e., core inflation measures the part of inflation that is not due to energy and food prices.
The strong correlation between headline and core inflation during the early 1970s appears in Figure 4. In Figure 4, I use sticky-price core inflation (the picture is almost the same if I use “normal” core inflation), as sticky prices are better indicators of the persistence of inflation, see link).
Data source: FRED of St. Louis Fed.
Today, headline and core inflation divert. Energy prices have been falling the past couple of months, as mentioned, dragging down headline inflation, but other prices have not. This means that core inflation continues to rise despite falling energy prices, as Figure 5 reveals. Headline inflation has been falling for six months, but core inflation has not. In fact, in December 2022, sticky-price core inflation surpassed headline inflation. This is worrying, and an important difference to the 1970s. It indicates that it will be a tougher battle to get inflation under control than it was back then.
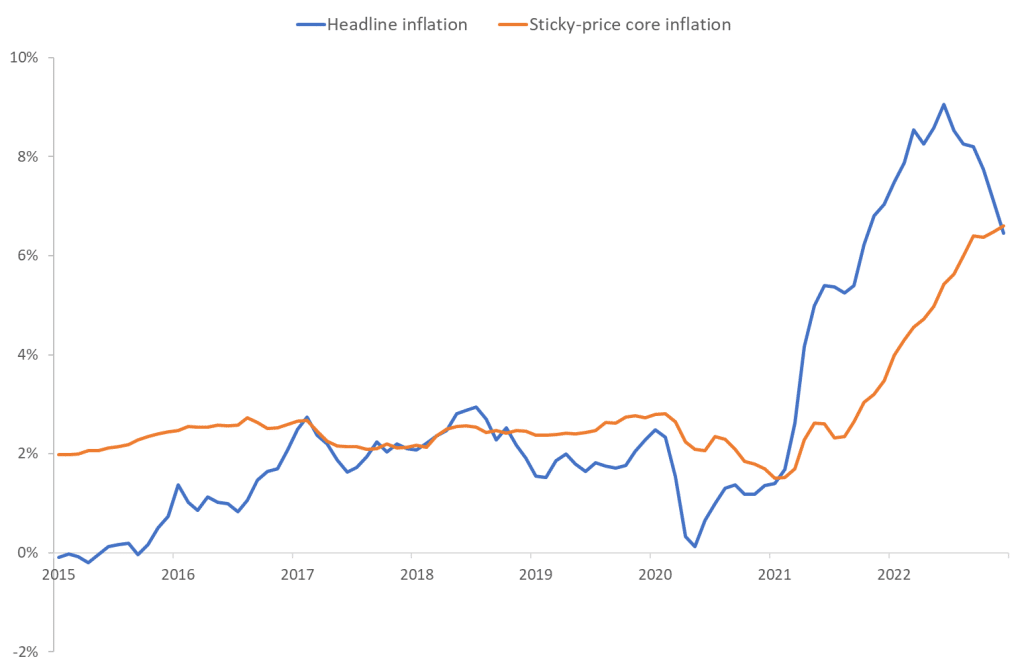
Data source: FRED of St. Louis Fed.
There is thus reason to believe that headline inflation might diverge from the path it followed in the 1970s. Or, in simple words, I doubt inflation will reach 2% in July 2024, as otherwise indicated by Figure 1.
The Fed itself does not believe either inflation will be 2% in 2024. Its latest projections (link) indicate that inflation will be above 2% in 2024, at 2.5%. The Fed expects inflation will remain above target until 2025, when it will be 2.1% (The ECB, by the way, similarly expects inflation in the euro area to reach target in the second half of 2025 only, link).
Do not repeat the mistakes of the 1970s
The final point I would like to make here is that the 1970s taught us not to let the guards down too early.
Consider Figure 2 again. It shows that the Fed Funds Rate followed inflation on the way up, but also on the way down. As soon as inflation started falling in the early 1970s, the Fed reduced the Fed Funds Rate, Figure 2 shows. This was too early. It implied that the real interest rate fell too fast and too much. As I showed in Figure 3 in this analysis (link), the real Fed Funds Rate was negative during the 1974-1980 period, meaning monetary policy did not contribute to reigning in inflationary pressures but, in fact, stimulated inflation. The result was that inflation increased too much during the late 1970s, as shown in Figure 6.
Data source: FRED of St. Louis Fed.
Figure 6 adds six years to Figure 1. It shows that the second wave of inflation in the late 1970s was even more dramatic than the first.
I argued in my previous analysis (link) that Germany did better than the US in the late 1970s because German monetary policy was tighter. If the Fed had not lowered the Fed Funds Rate so fast after the first wave of inflation in the early 1970s, there is reason to believe that inflation had not increased as much during the second wave.
This is a warning. The Fed needs to keep a steady hand on the tiller. Despite calls to reduce rates soon, because the economic outlook darkens, the Fed needs to keep rates high enough for long enough. The 1970s taught us that not doing so resembles a “kick of the can down the road” approach, and the subsequent price to pay becomes so much higher. In the late 1970s/early 1980s, the Fed had to implement draconical interest rate hikes, causing a severe recession, to get inflation under control.
If the mistakes of the 1970s are repeated this time around, and inflation follows the same path as in the 1970s, the second round of inflation would be in 2026-2030, Figure 6 reveals.
My best guess, my hope you might say, is that this will not happen. I believe the Fed is concerned about its reputation after its failure to understand the persistence of post-pandemic inflation, meaning they will be keen to enforce their mandate. If this is correct, we should avoid a second-round peak in inflation.
Conclusion
The behavior of US inflation during the past 5-10 years has been strikingly similar to the behavior of inflation during the early 1970s. If this continues, inflation should be back on target in mid-2024.
There are two important differences to the 1970s, however. First, monetary policy reacted too late this time around. This means there is a real risk inflation will be more difficult to combat than in the 1970s. Second, derived from the first point, core inflation followed headline inflation during the early 1970s, both when inflation rose and when it fell. Today, headline inflation has been falling for the past six months, while core inflation has not. This is worrying. It indicates that underlying inflationary pressures are more pronounced today than in the early 1970s. If correct, which I think it is, it will be more difficult to get inflation under control than in the early 1970s. Consequently, I believe the Fed should keep interest rates elevated for at least one more year.
This post has originally been published here.