By Cliff Asness – AQR Capital Management: The Federal Reserve has an explicit dual mandate. Managed Futures strategies have an implicit one—specifically, 1) deliver positive returns on average and 2) generate especially attractive returns during large equity market drawdowns. This dual mandate is one of the big reasons managed futures strategies can be valuable in a portfolio. Unfortunately, by and large, the industry—intentionally or not—has been optimizing for one at the expense of the other. Admittedly I have a self-serving axe to grind here as we believe we stuck to the dual mandate and suffered for it for quite a while (but not lately!).
Exhibit 1 shows what I’m talking about, using the SG Trend Index as a proxy for the industry (“Industry Trend”), and the AQR Managed Futures Composite as a proxy of “Pure” trend-following. Both pass Mandate #1 (positive average returns), but not Mandate #2 (especially attractive returns when most needed). How can this be? The rightmost set of bars—performance when equities did especially well—is the smoking gun (I know it may seem odd for me to crow over the periods when we underperformed, but I think it will make sense soon).

September 1, 2009 – June 30, 2022. Source: AQR, Bloomberg. “Pure Trend” is the AQR Managed Futures Full Volatility Strategy; “Industry Trend” is the SG Trend Index. Dates chosen to coincide with the inception of the AQR Strategy. Equity Top and Bottom Decile Months are the best and worst 10th percentile months for MSCI World over the period shown. All data is shown net of fees. Pure Trend is net of a 1.36% management fee per annum. Past performance is not a reliable indicator of future performance. For illustrative purposes only.
AN INDUSTRY THAT GOT CARRIED AWAY
Let’s go back a decade or so. Managed futures were a rare bright spot among alternatives in the Global Financial Crisis (GFC). However, since then—and until fairly recently—strategies built to profit from price trends have had a hard road to hoe. Since the GFC, markets have trended less than their historical norm. Also until fairly recently, while there have been some scary times, markets have generally been quite strong. Markets trending less than normal (i.e., a challenge for Mandate #1) and few tails to hedge (i.e., little need for Mandate #2) has been a desultory combination for the managed futures industry.
But bad times happen to good strategies. Everybody knows that. So, what’s the right thing to do when a good strategy with over 100 years of evidence across a very wide range of markets and with solid economic intuition has a decade of tepid performance for reasons that are quite easy to explain? Naturally, you change it, right? This (in an admittedly snarky nutshell) is what seems to have happened to much of the managed futures industry.
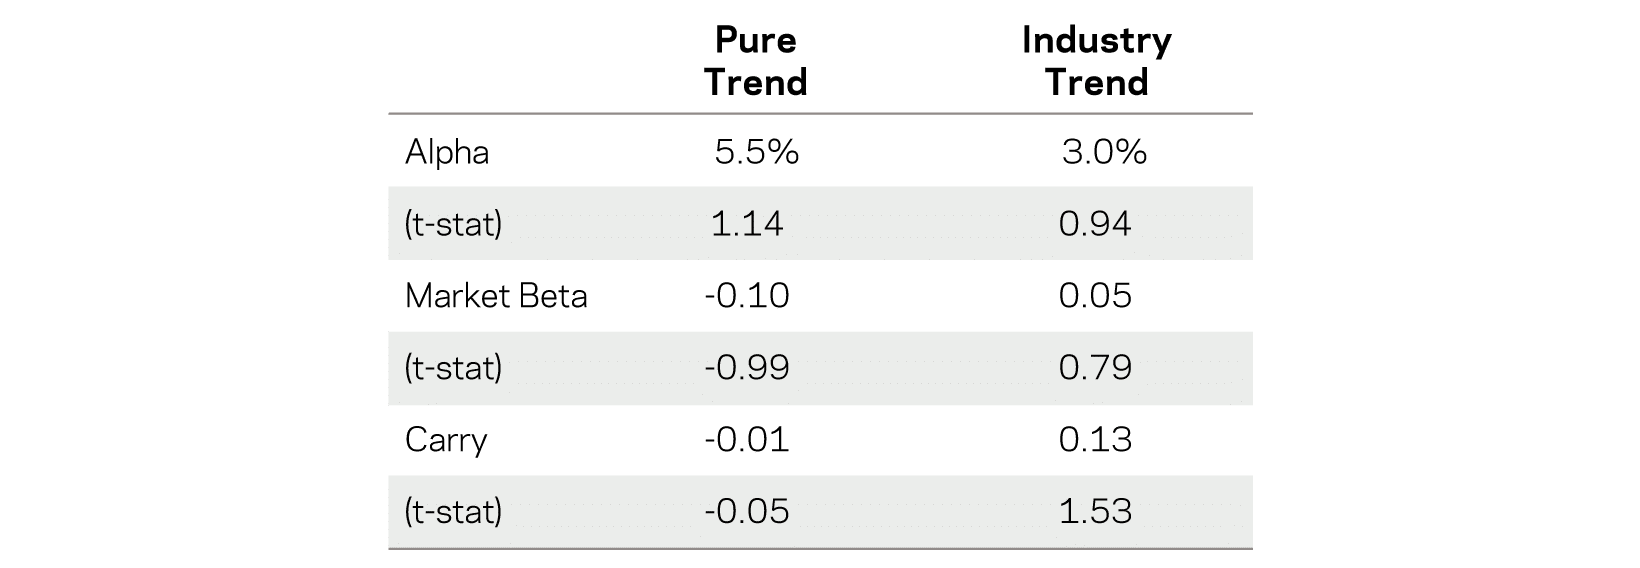
Let’s look at the facts. The first thing we’ll want to analyze is exposure to equities, as during a bull market, exposure to markets should be a boon to average returns and a detractor in bad times. I use two versions of managed futures: the first is AQR’s version of trend-following (“Pure Trend”), and the second is the industry in general, proxied by the SG Trend Index (“Industry Trend”) and regress each on the global stock market.

Over the whole period it looks like a behind-the-scenes victory for Pure Trend (i.e., AQR). If anything, we have been a slight hedge against market moves (though not statistically significantly), and the SG Index the opposite. Thus, the “problem” for Pure Trend isn’t its alpha—it’s that markets have gone up spectacularly. But we think it means we’ve stuck more to what managed futures is supposed to do.
Let’s add one more thing to the regression. Anecdotally (from lots of sources) many managed futures managers try to improve their Sharpe ratios and realized total returns by adding carry strategies. That’s fine if you’re trying to improve Mandate #1, but carry is often a “risk on” strategy. Thus, it can become a real problem when it comes to Mandate #2. So now we’ll add a simple carry strategy to our regression.
The alpha gap has widened once more, with AQR now adding near double the alpha net of these exposures (exposures you don’t want in managed futures if its job is to save you in a downturn). Which brings us to the betas—what about the exposure to stuff that compromises Mandate #2? The above table shows a 1.53 t-statistic on carry for the industry, and that doesn’t pass traditional hurdles of statistical significance. So maybe there’s really nothing there?
Actually, there is something but you can’t see it in the above regressions. Below is an easier way to see it. It’s the same table we just saw, but in the last column I take Industry Trend minus Pure Trend to show how far managed futures as an industry have strayed from what they purport to do.
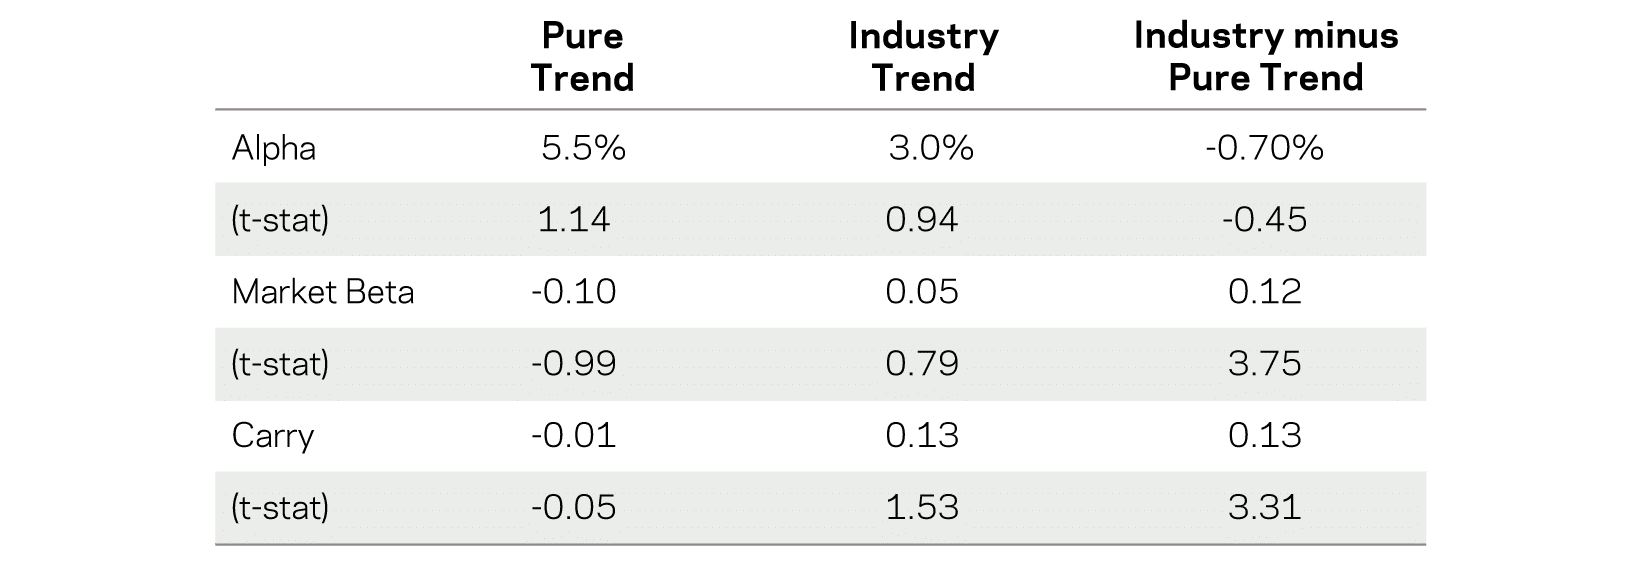
This last table is why we feel pretty good about the choices we’ve made compared to the industry. The differences hurt us when things were mostly very good for the world—i.e., when market beta and carry strategies were doing well. But we didn’t stray from our purpose. Our version of managed futures has been competitive, though slightly behind the SG Trend Index over the past five or so years of a raging bull market. And unfortunately, that’s a horizon over which much of the world compares managers. However, adjusted for the industry’s general bullish equity and carry exposures, we’ve actually won (albeit by a statistically weak amount) over our full history (and we argue that adjusting for these exposures fits the point of managed futures).
TATTLE-TAIL HEDGERS
We’ve now seen how “Pure Trend” and “Industry Trend” have differed on average. Industry Trend, in seeking to look better on Mandate #1 (positive returns on average), picked up exposure to things we’d expect to weaken its ability to deliver on Mandate #2 (especially attractive returns when most needed). We can see this more directly, and perhaps more relevantly—regression averages are nice, but huge drawdowns for traditional assets are more to the point—by comparing their performance during the three worst drawdowns for traditional portfolios since the GFC.
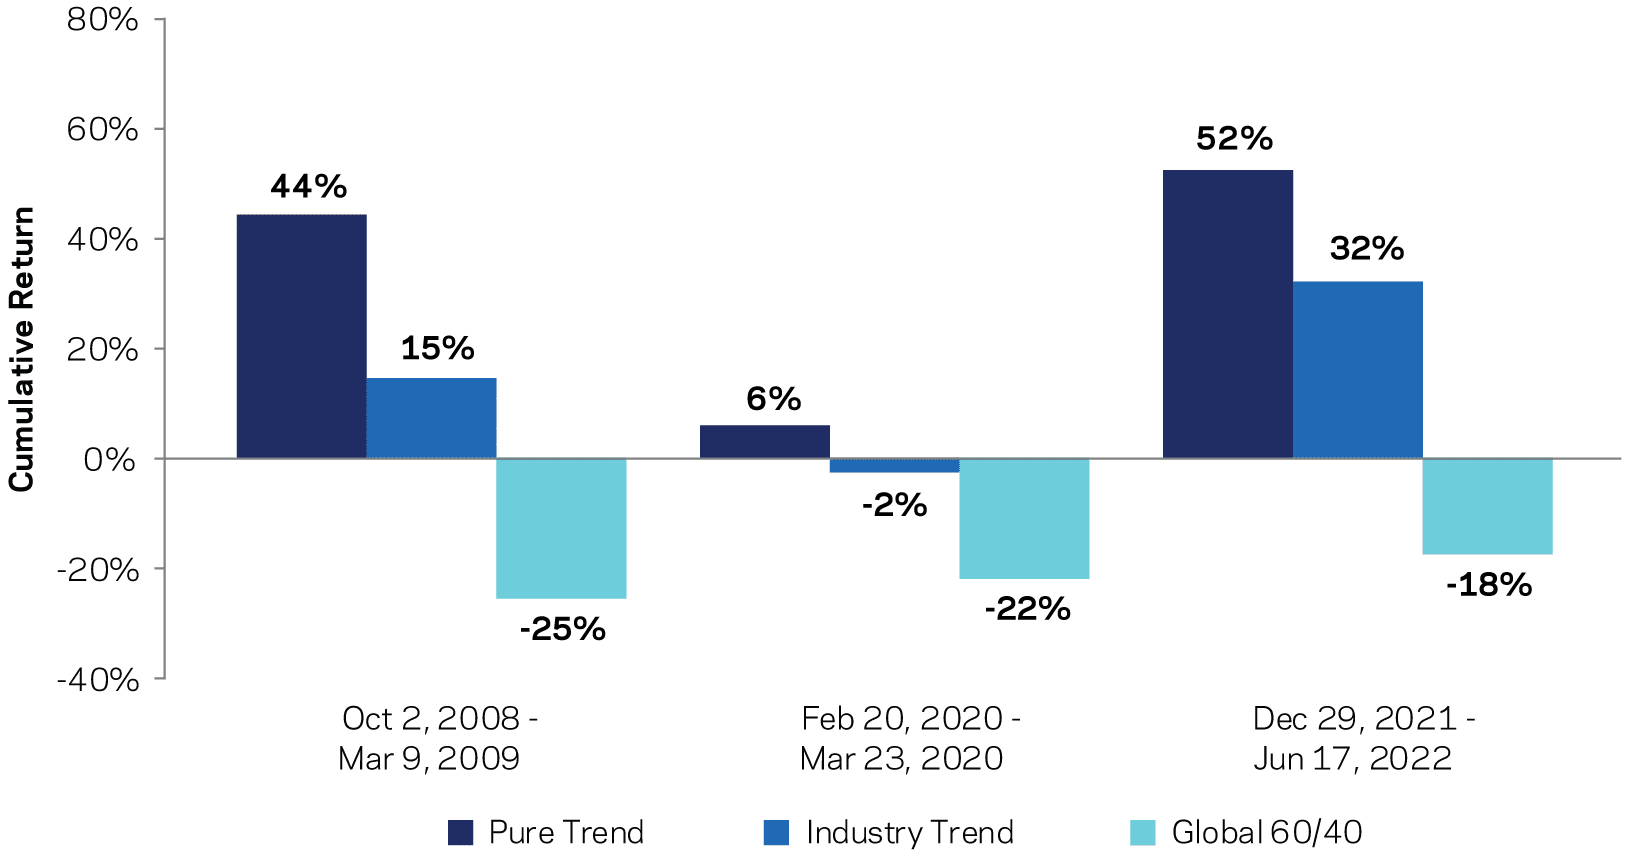
Oct 1, 2008 – June 30, 2022. Source: AQR, Bloomberg. “Industry Trend” is the SG Trend Index. “Pure Trend” is a hypothetical AQR Managed Futures series which is scaled to 15% volatility to approximate the volatility of the average strategy in the SG Trend Index. All data is shown net of fees. The hypothetical Pure Trend series is net of a 1.2% management fee per annum. Global 60/40 is 60% MSCI World and 40% Barclays Global Aggregate Hedged USD. Hypothetical data has inherent limitations.
These are not inconsequential numbers. The average drawdown of 60/40 across the three above is -22%. The average return of Pure Trend is 34%, meaning a 10% allocation to Pure Trend saved 5.6% on average in these drawdowns (and if it were a nice 20% allocation, you know you could double that, because math!). In contrast, Industry Trend saved you a bit more than half that.
I’ve got nothing against exposure to equities and carry strategies— but when wrapped into managed futures it can be a problem, as it is contrary to part #2 of their reason for living. In good times (e.g., most of the post-GFC period), the kinds of managed futures everybody likes best are the ones with the highest average return (as opposed to ones having the best defensive characteristics). However, what that can mean is the investors themselves have traded off one mandate for the other. Whether they’ve done that intentionally or by chasing returns too much is another question unanswerable with the data.
A weakened ability to deliver on Mandate #2 may be especially problematic today. One of the biggest areas of growth in the “alternatives” industry is in illiquids, such as private equity. I’ve cathartically written about how “great” smoothed returns can be for the investment manager—but for the investor, what you often get is a mirage of lower volatility and lower market risk, even though the underlying economic exposures are pretty much the same.
Smoothing returns helps conceal market drops that quickly recover, like the COVID shock. However, it can’t help against a very protracted bear market where eventually you need to mark your positions. The bright side for managed futures strategies, though, is that they are designed to do well in exactly these types of slow-moving train wrecks. In other words, tough times for private equity tend to be great for trend-following. Thus, Mandate #2 is likely especially important for investors who’ve increased their allocations to privates and illiquids since the GFC.
STAND BY YOUR MANDATES
Like others, we always want to improve our process. But improving something that you already believe is a long-term good strategy is fraught, especially when in reaction to a period of weak returns. Biases can come in. Grizzled veterans like tried-and-true strategies; newer market participants are biased toward the cool and new— and these are often at odds with each other (guess which one I am 😀). And regardless of when you decide to add something new to the process, something to always worry about is data mining.
But too often “innovation” is taken to mean “something totally new”. It doesn’t have to be; for strategies like managed futures, we think innovations can be—and ideally should be—firmly tied to the core thesis of the strategy itself (i.e., investors systematically under-react to information). This can help ensure changes don’t come at the expense of Mandate #1 or Mandate #2.
This article features in HedgeNordic’s “Systematic Strategies” publication. The full article was originally published here.
Disclosures
The views and opinions expressed herein are those of the author and do not necessarily reflect the views of AQR Capital Management, LLC, its affiliates or its employees.
Past performance is no guarantee of future results. Diversification does not eliminate the risk of experiencing investment loss.