By Artur Sepp (pictured) of Quantica Capital AG: A key question of any institutional investor in times of high equity valuations and record low yields is: What are the most effective diversifiers for a balanced 60/40 equity/bond portfolio? Despite its simplicity, a typical 60/40 portfolio has been able to deliver persistently strong risk-adjusted returns over the past decades. Still, because of its dominant risk exposure to equities, and the limited risk diversification potential of the bond component, such portfolios have not always been immune to larger drawdowns in times of equity market stress.
“Despite its simplicity, a typical 60/40 portfolio has been able to deliver persistently strong risk-adjusted returns over the past decades. Still, because of its dominant risk exposure to equities, and the limited risk diversification potential of the bond component, such portfolios have not always been immune to larger drawdowns in times of equity market stress.”
During the recent Corona crisis, typical 60/40 balanced equity/bond portfolios have suffered from greater than 20% declines, from their peak values, in a short period of time. Although not a new topic, improving drawdown protection without compromising long-term risk-adjusted returns is more important than ever. A common approach to achieving greater diversification is to look at complementing alternative investment solutions that display low correlation to the 60/40 portfolio. However, all too often this approach fails, as it does not take into account the behavioral differences during different market regimes.
Measuring and Identifying a Good Diversifier
Answering our initial question requires a clear definition of what an “effective diversifier” means in this context. Low correlation to the portfolio alone is not sufficient to imply that an investment strategy provides the desired diversification. What investors should look for, in order to achieve “Smart Diversification”, is negative correlation in down markets and positive correlation in up markets. With this objective in mind, we introduce a framework to quantify the diversification benefits of alternative strategies.
The concept of “Smart Diversification” will be illustrated on a range of hedge fund and alternative risk premia indices from Société Générale, Barclays, HFR and Eurekahedge. We will also include the Quantica Managed Futures (“QMF”) Program in our analysis, the track record of which goes back to 2005.
Smart Diversification Methodology
Our Smart Diversification methodology is based on the analysis of isolated benchmark-specific regimes over a given observation period (e.g. weekly, monthly, quarterly). We will use the S&P 500 Balanced 60/40 Equity and Corporate Bond Index (SPXNBT) as our benchmark. Because balanced portfolios are typically associated with a longer investment horizon, we chose to measure the diversification benefits over a medium-term, i.e. quarterly time frame. As such, we define three different regimes, based on non-overlapping quarterly returns of the benchmark. We label market regimes:
- as Bear regime when returns of the benchmark are below the sample’s 16%-quantile;
- as Bull regime when returns are above the sample’s 84%-quantile;
- as Normal regime when returns are in-between the 16%- and 84%-quantiles.
The justification for using a 16%-84% range is that these thresholds correspond to the percentiles below/above one standard deviation of a normally distributed sample.
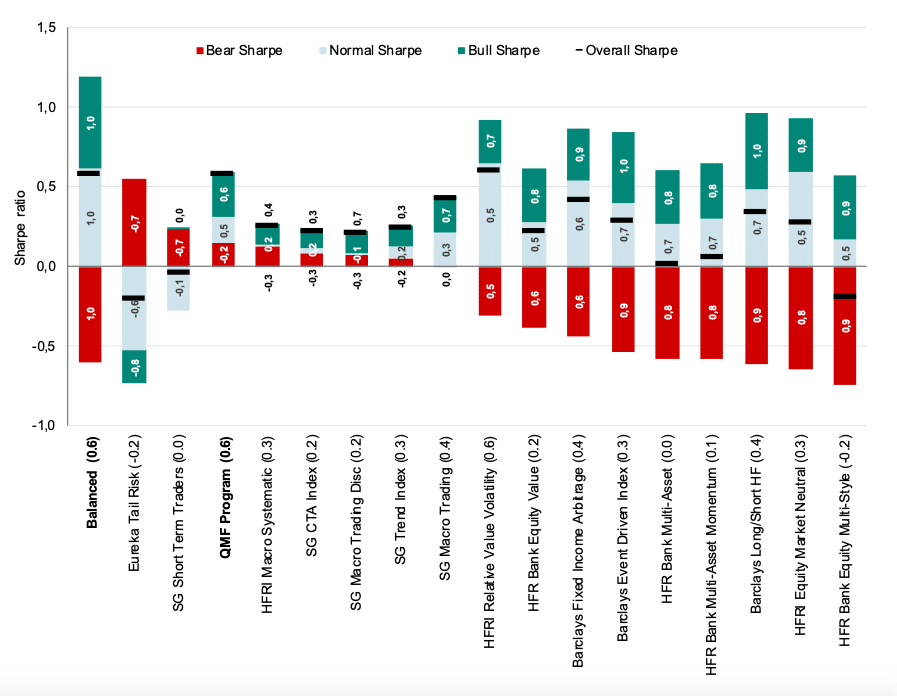
Based on these regimes, one can compute regime- conditional averages of quarterly excess returns (over the 3-months T-Bill rate) for each alternative strategy considered. Excess returns are then annualized by the frequency of each regime, and divided by the in-sample annualized volatility measured over the full history. The result is a regime-conditional Sharpe ratio attribution for each strategy, as shown in Figure 1. The numbers shown inside the bars show the corresponding regime- conditional correlations of the strategy against the Balanced benchmark.
Smart Diversification seeks to identify strategies that deliver positive Sharpe ratio contribution in all three regimes. Strikingly, most of the candidates, and in particular all risk premia proxies, fail to meet this criterion by producing significant negative Sharpe ratios in Bear regimes. Those strategies underperform and do not deliver diversification when it is most needed, i.e. in a stressed market environment. Tail risk and short- term strategies, on the other hand, do produce positive Sharpe ratios in Bear regimes. However, this comes at a significant cost of negative Sharpe ratio contributions in the remaining 84% of the time.
Figure 1 highlights that only a few alternative investment strategies appear to offer the desired Smart Diversification characteristics. These strategies are namely CTAs, trend-followers – including the QMF Program – and systematic and discretionary macro strategies.
Smart Diversification in a Portfolio Context
The previous analysis focused purely on the Sharpe ratios of individual strategies, but did not look at a portfolio’s risk-adjusted returns resulting from adding the strategies to the 60/40 benchmark.
We define an Overlay Portfolio as a fixed 100% allocation to the benchmark plus an additional variable allocation to an individual strategy. To account for the different volatilities of the strategies considered, we compute a range of Overlay Portfolios using volatility parity weights from 0 to 100%, and multiplied by the ratio of the benchmark volatility divided by the strategy volatility. Figure 2 shows the resulting Sharpe ratio vs the Bear Sharpe ratio for these Overlay Portfolios. The “Balanced (60/40) Portfolio” corresponds to a 100% allocation to the 60/40 benchmark. The corner portfolio, i.e. the end-point of each curve, corresponds to a volatility parity Overlay Portfolio, allocating the notional weight labeled to the strategy.
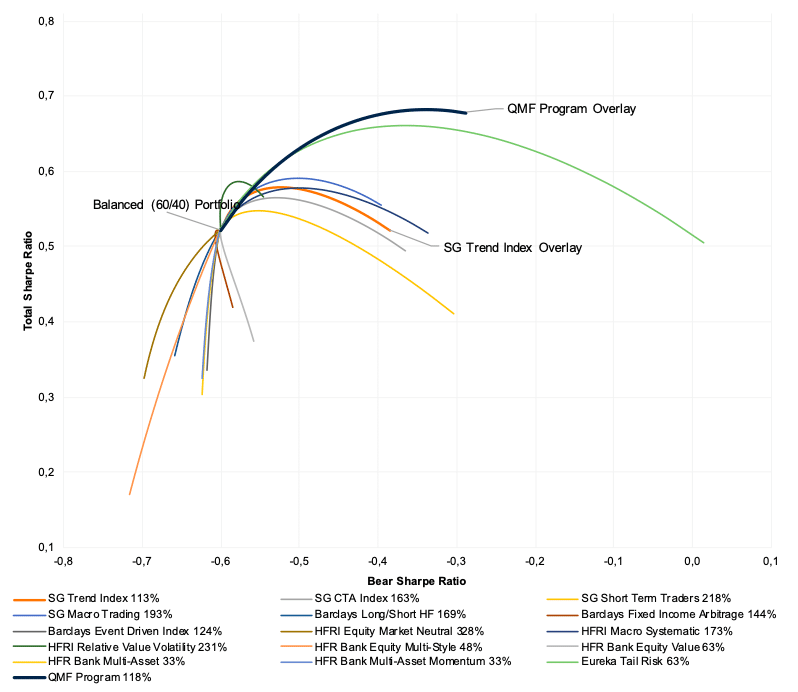
An upward sloping curve to the right means that the Overlay Portfolio increases the Sharpe ratio while, at the same time, improving the portfolio’s Bear regime characteristics.
Inversely, poor diversification benefits are resulting from strategies associated with downward sloping curves to the left, corresponding to a simultaneous reduction in total and Bear regime Sharpe ratios of Overlay Portfolios. As such, a large number of strategies in the above sample do not provide beneficial diversification benefits to the benchmark 60/40 portfolio.
Conclusion
The Smart Diversification framework offers a simple yet powerful tool for investors looking beyond simple correlation metrics to assess the diversification potential of an investment opportunity. As illustrated with the example of a balanced 60/40 portfolio, trend-followers, CTAs and certain macro strategies appear to be attractive candidates from a Smart Diversification perspective.
“The Smart Diversification framework offers a simple yet powerful tool for investors looking beyond simple correlation metrics to assess the diversification potential of an investment opportunity.”
Quantica’s Managed Futures Program is a specific example of a Smart Diversification strategy that has been able to generate positive returns in all different market regimes, while at the same time contributing to an increased Sharpe ratio in an Overlay Portfolio context.
This article featured in HedgeNordic’s report Systematic Strategies: When Numbers are the Key!