(Partner Content by Novus) – While the rest of the world made monumental leaps in big data and technology over the last couple of decades—thanks to remote sensors (aka the Internet of Things), ubiquitous Internet access, and smart machine-learning algorithms—the institutional investment community is falling pathetically behind.
Asset managers ranked 24th out of 34 industries surveyed in a recent Morgan Stanley research studyon digitalization. Along the same lines, Willis Towers Watson concluded in its 2018 Global Pension Assets survey that “the technology impacts on pension funds have been surprisingly light as evidenced by legacy systems that rely heavily on spreadsheets.”
This is quite a paradox, as the finance industry ingests, processes, and manufactures numbers for a living. We found two main reasons for this lack of progress.
First, members of our industry are obsessed with creating and disseminating data exogenous to one’s investment process, such as company fundamental data, price, and volume information. This is evidenced by the popularity of terminals like Bloomberg and Reuters.
In the process, we’ve largely neglected the generation and analysis of data that’s endogenous to our investment process, such as price targets, decision logs, investment hypotheses, conviction degrees, and commission/omission errors in portfolio construction. This lack of analysis is bizarre, because these parameters are more directly in our control than exogenous ones.
As much as we’d like to, we can’t affect company fundamentals or price charts, but we can decide whether to concentrate portfolios more, screen investment ideas earlier, increase check-points on the hypotheses formulated on a security we own, and so on.
The second issue is that, as practitioners, we’re obsessed with the outcome, aka returns—the only universal metric across investment styles, holding periods, and asset classes. Because of this, science revealed, we’ve often made the mistake of buying at the highs for fear of missing out.
What are we missing, and how can we take advantage of it?
For starters, we’re missing all the endogenous data that might provide insight on the way we make decisions. We’re also missing the ability to link these to exogenous data, allowing us to answer crucial questions such as, “Do we shy away from investing in securities whose momentum is stronger than average, and is that a good thing?”
Furthermore, we’re missing a ton of new exogenous data —called alternative data— that enriches the picture of securities we may invest in. Examples include ESG scores, credit-card-related consumption data, and many others, most of which are industry specific.
Finally—a very pertinent point for allocators—we’re often simply missing crucial data because we don’t ask for it. Ask any CIO of any multi-asset class portfolio who invests in external managers about their exposure to Japan (or to the Swiss Franc) right now and see if the answer is a few clicks away on their tablet (rarely), or if it takes three days of phone calls to managers, copying from custody records, and pasting into Excel to get it done.
Specific to the Japan and Swiss Franc exposures mentioned above, the difference between knowing and not knowing has meant billions for investors, as Fukushima and the Swiss Franc depeg were one-day events, which left no time for prolonged fact-finding quests.
Luckily investors can catch up and move ahead of others through Portfolio Intelligence, the transposition of the much-touted business intelligence discipline for the institutional investment community. Novus pioneered the term more than a decade ago and has developed the leading portfolio intelligence platform for the world’s most sophisticated investors.
Portfolio Intelligence is technology that allows investors to stay on top of their portfolio, push transparency to the extreme, and make data actionable through sophisticated, immediately available analytics accessible everywhere.
Through Portfolio Intelligence, Novus clients can slice and dice their portfolio up and down the ladder (from a single security held by one of the managers they invest in up to asset allocation at the top level) and left and right in time along exposures, risk, and attribution.
From there, investors can perform basic data manipulations (group by, filter by, scale by) and sophisticated analyses (am I entering positions too early?) in no time, thanks to parallelized calculations and cloud-based computing.
Finally, they can create custom reports, schedule their updates and delivery, and build a selective permission system authorizing certain views only to certain individuals, thus putting to bed the nonsensical practice of PDF reports attached to emails. So ’90s.
Portfolio Intelligence
Basic Navigation
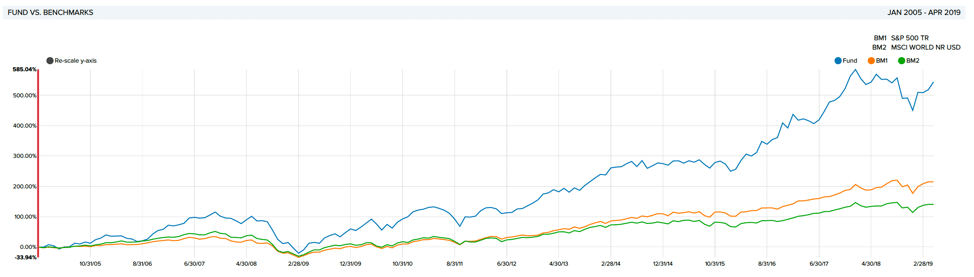
Let’s assume we’re sitting in our quarterly investment committee, and our equity portfolio is up on the screen for review with one of us maneuvering from a tablet. Let’s start by reviewing inception-to-date performance vs. our custom benchmark, as in Figure 1.
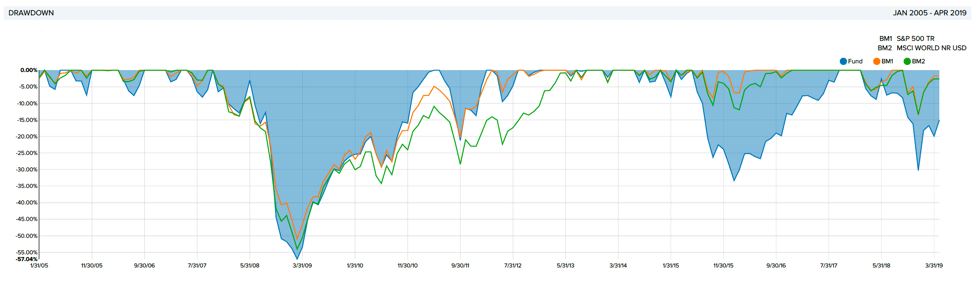
We notice our drawdowns seem more severe than our benchmark, and we click on the deep-dive offered by Figure 2. Observing that the deep blue area typically falls harder and faster than the benchmarks, we see that our hypothesis is corroborated by the data.
But why? Looking at the return drivers depicted in Figure 3 for every single security we’ve held since inception, we notice that market moves have been unfavorable (blue in the stacked bar chart), while security selection has favored us. Perhaps we should dive further into testing the hypothesis by looking at it from the risk angle, complementing the attribution angle investigated here.
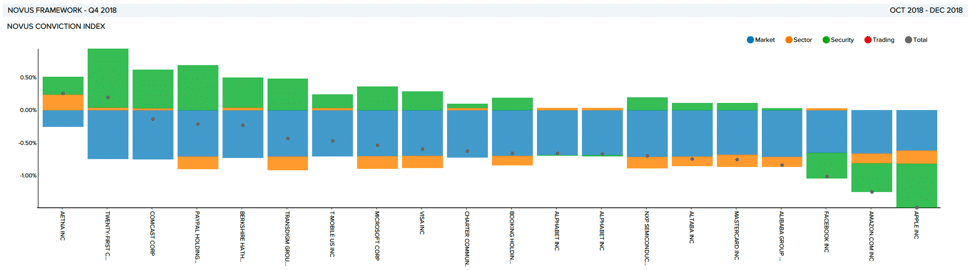
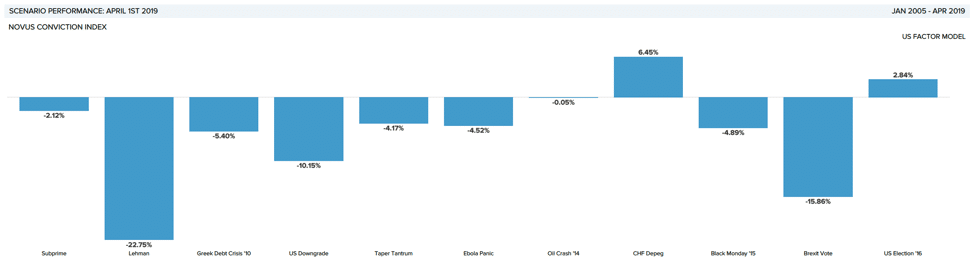
Figure 4 displays the expected shortfall against a number of classic stress tests. We note that the biggest drawdown would materialize from a Lehman-like equity market shock, further corroborating our hypothesis.
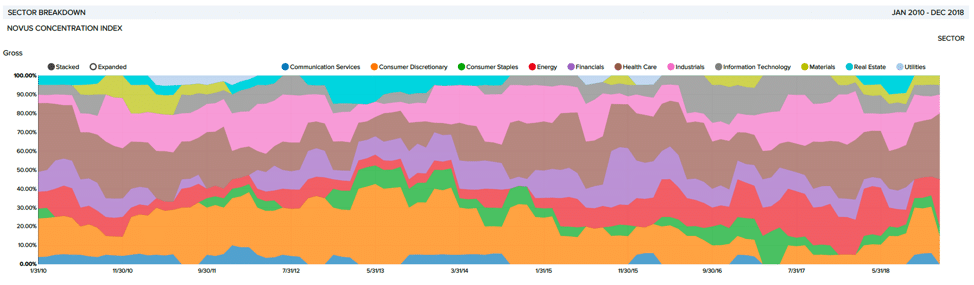
We’ve clearly accumulated excessive market exposure in the portfolio and must investigate where it’s coming from. We want to analyze whether our exposure to more cyclical sectors has increased (Figure 5). We note that, while Consumer Discretionary exposure has recently increased (highlighted in orange below), our Healthcare exposure did as well (a counter-cyclical sector). Thus, this hypothesis is not corroborated by the data.
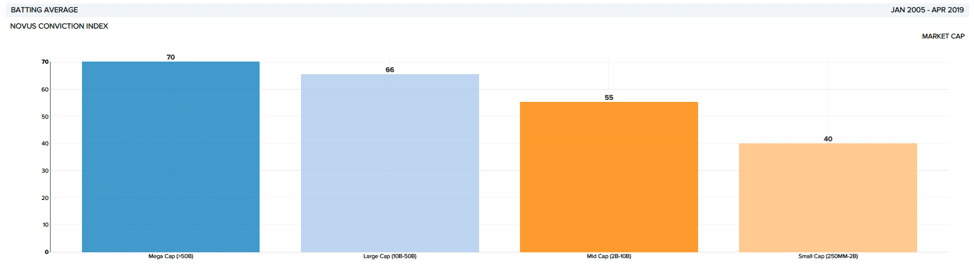
We decide to reduce our market sensitivity by increasing our exposure to larger market cap stocks, which, we believe, will also benefit liquidity. Before deciding to do so, we verify whether our historical skill set is aligned with the intended move and check batting averages by market cap bucket, clicking ourselves through to Figure 6. Indeed, we seem to be good at picking stocks in the larger market cap bands, as batting averages increase the higher the market cap.
We exit the meeting with clear marching orders.
While the above was just an example, the reality is much more complex and multi-faceted. That said, note how easy and fluid the investigation was, especially when contrasted with how these scenarios usually unfold in organizations today.
In all likelihood, one of us would have had to stop at the first question, task someone with finding the answer, wait for them to extract the numbers from our servers, maneuver them in R/Python/Matlab, chart them in PowerPoint, export them in PDF, send them as email attachments to the rest of us, and effectively destroy a Sunday evening. By the time we do see the numbers —probably a week later— we realize that we weren’t specific on the time range underlying the analysis. Not having specified inception-to-date, we now have a PDF report with the trailing twelve-month data with no way to adjust it without repeating the entire process all over again—something that’s possible with a single click on our platform.
Advanced Enrichment
In the above, we’ve covered the basics of performance analytics, attribution statistics, and categorical analysis (sector and market cap). Over and beyond these basics, what sets Novus clients apart is the quest to push the analytical boundaries of their intellectual curiosity. Novus provides this as a fluid and smooth experience. In the following, we present two case studies inspired by client work of this kind.
Case study 1 – The Novus Conviction Index
Several Novus clients observed throughout recent years that long positions held by their US Equity Long/Short managers were increasingly the same. Some of them were also visible through public filings, which, despite their infrequent publication (they are refreshed quarterly and published with 45 days lag), still contained insightful information content. Indeed, some managers hold securities for 18 months or more, making the quarterly frequency and 45-day lag almost irrelevant.
To transform the intuition into an actionable investment paradigm, Novus developed a Conviction Index comprised of the highest conviction equities held by hedge fund stock pickers. Investors interested in following the aggregate wisdom of the crowd can now seek exposure to the index, generating alpha from the insight, and, incidentally, saving significant fees in the process.
Case Study 2 – Environmental, Social, and Governance (ESG) Analytics
In response to growing demand from our clients across the world, we entered into a partnership earlier this year with specialized data vendors to offer investors an efficient way to analyze the performance of their investments based on Environmental, Social, and Governance themes (ESG). We have developed data connectors that can automatically overlay ESG data onto portfolios to monitor exposure and risks, while driving insights into the factors that are influencing portfolio returns.
Our technology obtains scores from a variety of scoring companies (or from datasets provided by clients), weights the scores according to a defined aggregation logic, and marries the data to specific portfolio information already in our system.
Figure 7 illustrates one specific way of looking at the data, inspired by a client of ours, where exposures grouped by each of the three ESG Ratings (one chart corresponds to each of the E, S, and G dimensions) are compared to the equivalent for a benchmark of their choice. Further, the differences between portfolio vs. benchmark exposure are calculated, highlighting whether our portfolio has an over- vs. under-weight exposure to higher/lower ESG-rated securities.
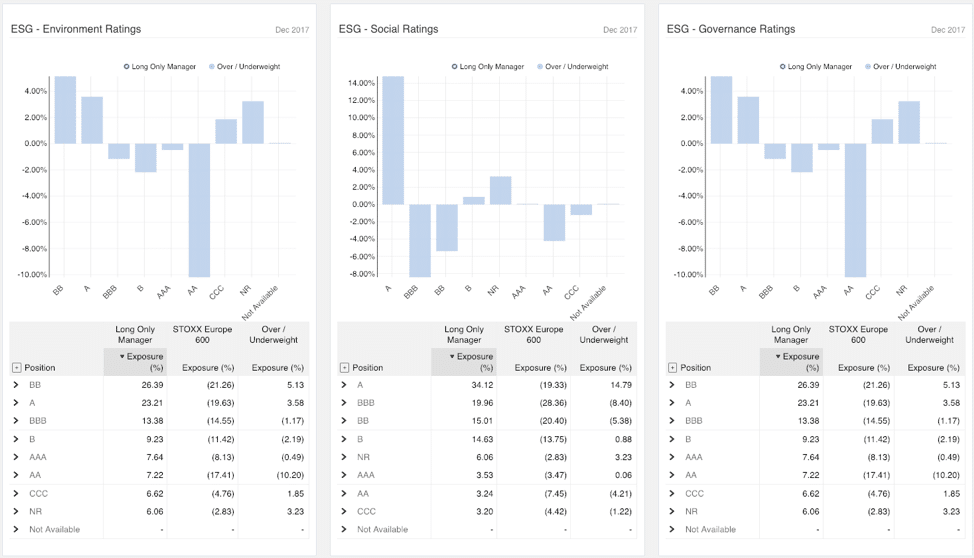
An analysis like the above would require a week to prepare. With Novus, it’s a seven-second exercise to configure.
Conclusions
It’s time for investors to enter the new millennium of investment analytics through Portfolio Intelligence. Have the courage to bid farewell to self-made in-house software (pleasurable to build, unscalable to use) and to analytics powered by highly inefficient copy-paste-from-PDF, massage-in-Excel, plot-in-PowerPoint, re-extract-to-PDF, send-as-email-attachment, save-to-folder process.
Give us a call. Around 150 institutional investors have embraced the priority and are working with Novus to take advantage of Portfolio Intelligence daily. Join them.
Picture: (c) Elnur—shutterstock.com