

By Steven Braun at Newfound Research and Return Stacked® Portfolio Solutions: Despite its ambiguous origins, the 60/40 remains the default portfolio for investors approaching retirement, and something close to it is what most still hold when decumulation begins.
The portfolio works mostly by simple de-risking. Sixty cents of every dollar is tied to equity risk. The rest is parked in bonds that pay a near-certain nominal return and have provided a meaningful offset to equity risk in past crashes like 2000 and 2008.
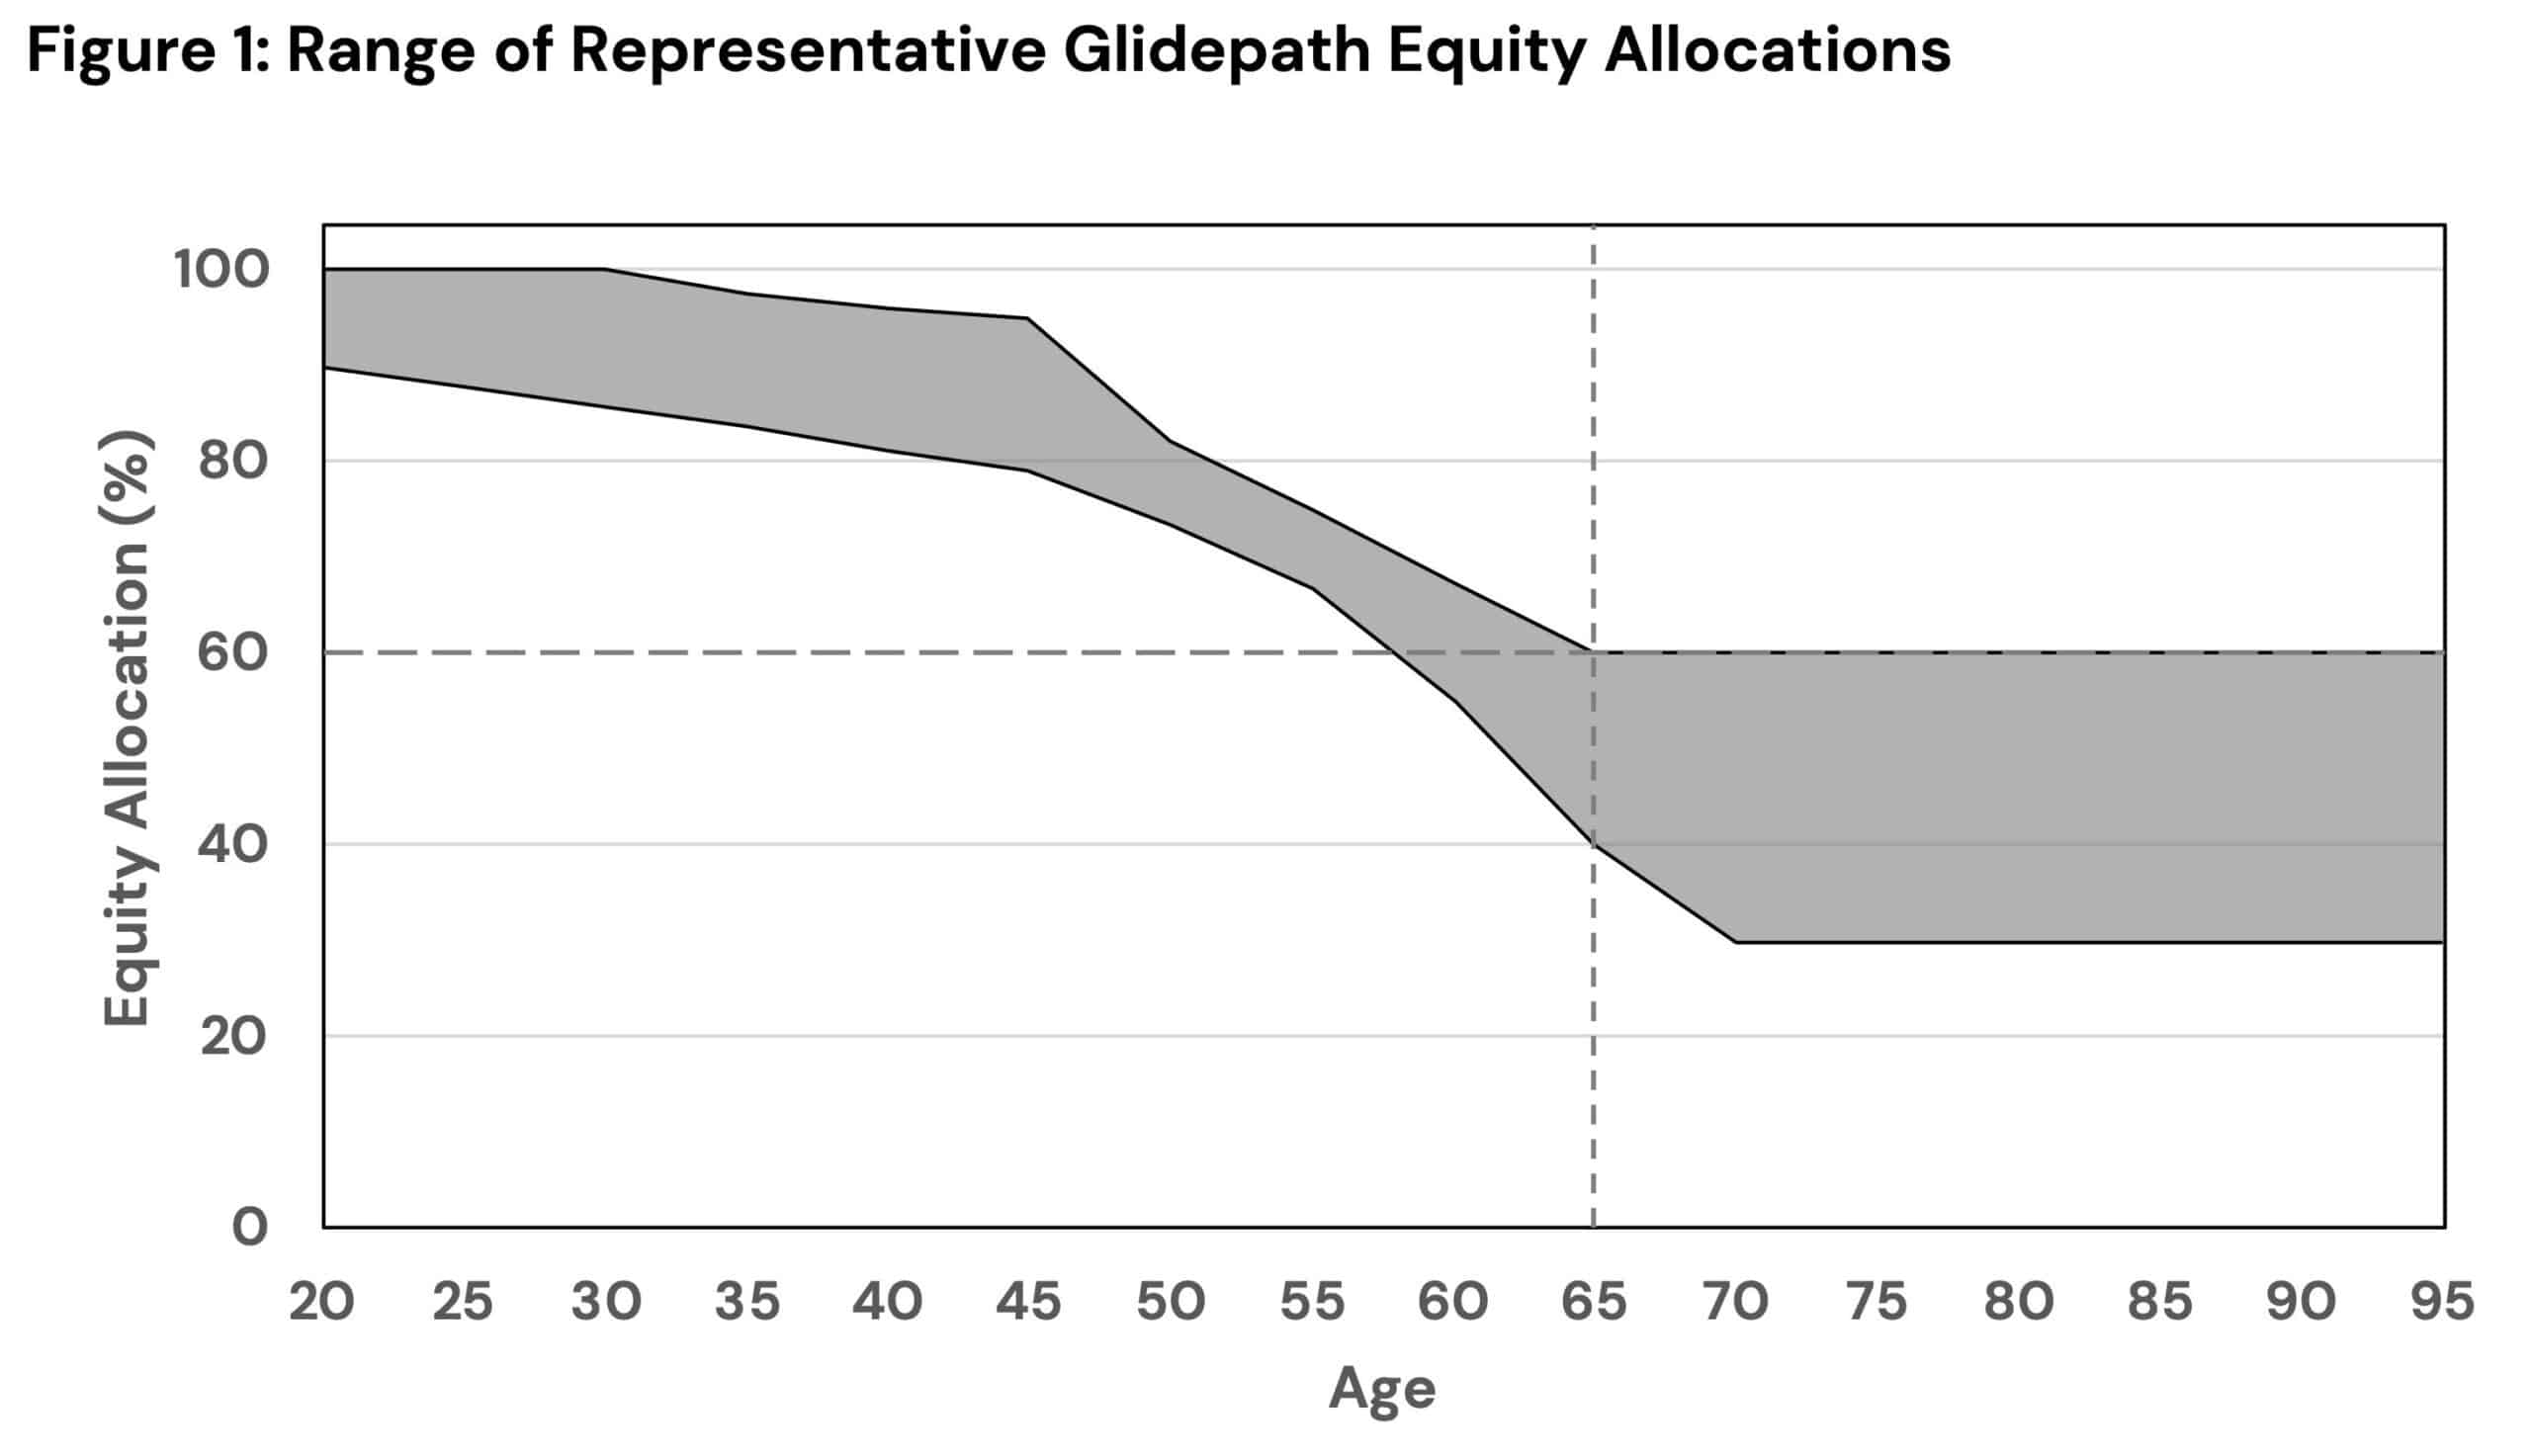
The portfolio works mostly by simple de-risking. Sixty cents of every dollar is tied to equity risk. The rest is parked in bonds that pay a near-certain nominal return and have provided a meaningful offset to equity risk in past crashes like 2000 and 2008.
Inflation is the weak point. A sharp rise erodes the bond’s promised return in real terms, and history says stocks usually fall alongside.
Explicit de-risking has a cost of its own, too. Portfolio growth still largely relies on the 60%, so if equities go nowhere for a decade, the total return of bonds may not deliver the performance that a given retirement plan has presupposed.
Shocks like these can arrive at any age. What changes near retirement is what they cost the portfolio in longevity. But rather than asking whether to bury the 60/40 – a portfolio investors have historically been able to hold through cycles – we ask whether we can reinforce it.
The Fragile Decade
Between ages 60 and 70 is sometimes referred to as ‘the fragile decade’. It is when the 60/40’s blind spots and the holder’s vulnerability arrive together.
At 60, the portfolio – hopefully – sits near its lifetime peak, so a single percentage point of return moves more wealth than it ever has. The two remedies that carry a saver through earlier drawdowns, saving more and working longer, are both nearly spent.
Once withdrawals begin, a decline stops being something to ride out and becomes a liquidation: what is sold into a falling market is no longer there to participate in the recovery.
A portfolio earning a 5% real return that suffers a 30% real drawdown would be expected to recover to its inflation-adjusted high-water mark in just over seven years. Ongoing withdrawals, however, can extend that recovery period substantially, potentially beyond the investor’s remaining lifetime.
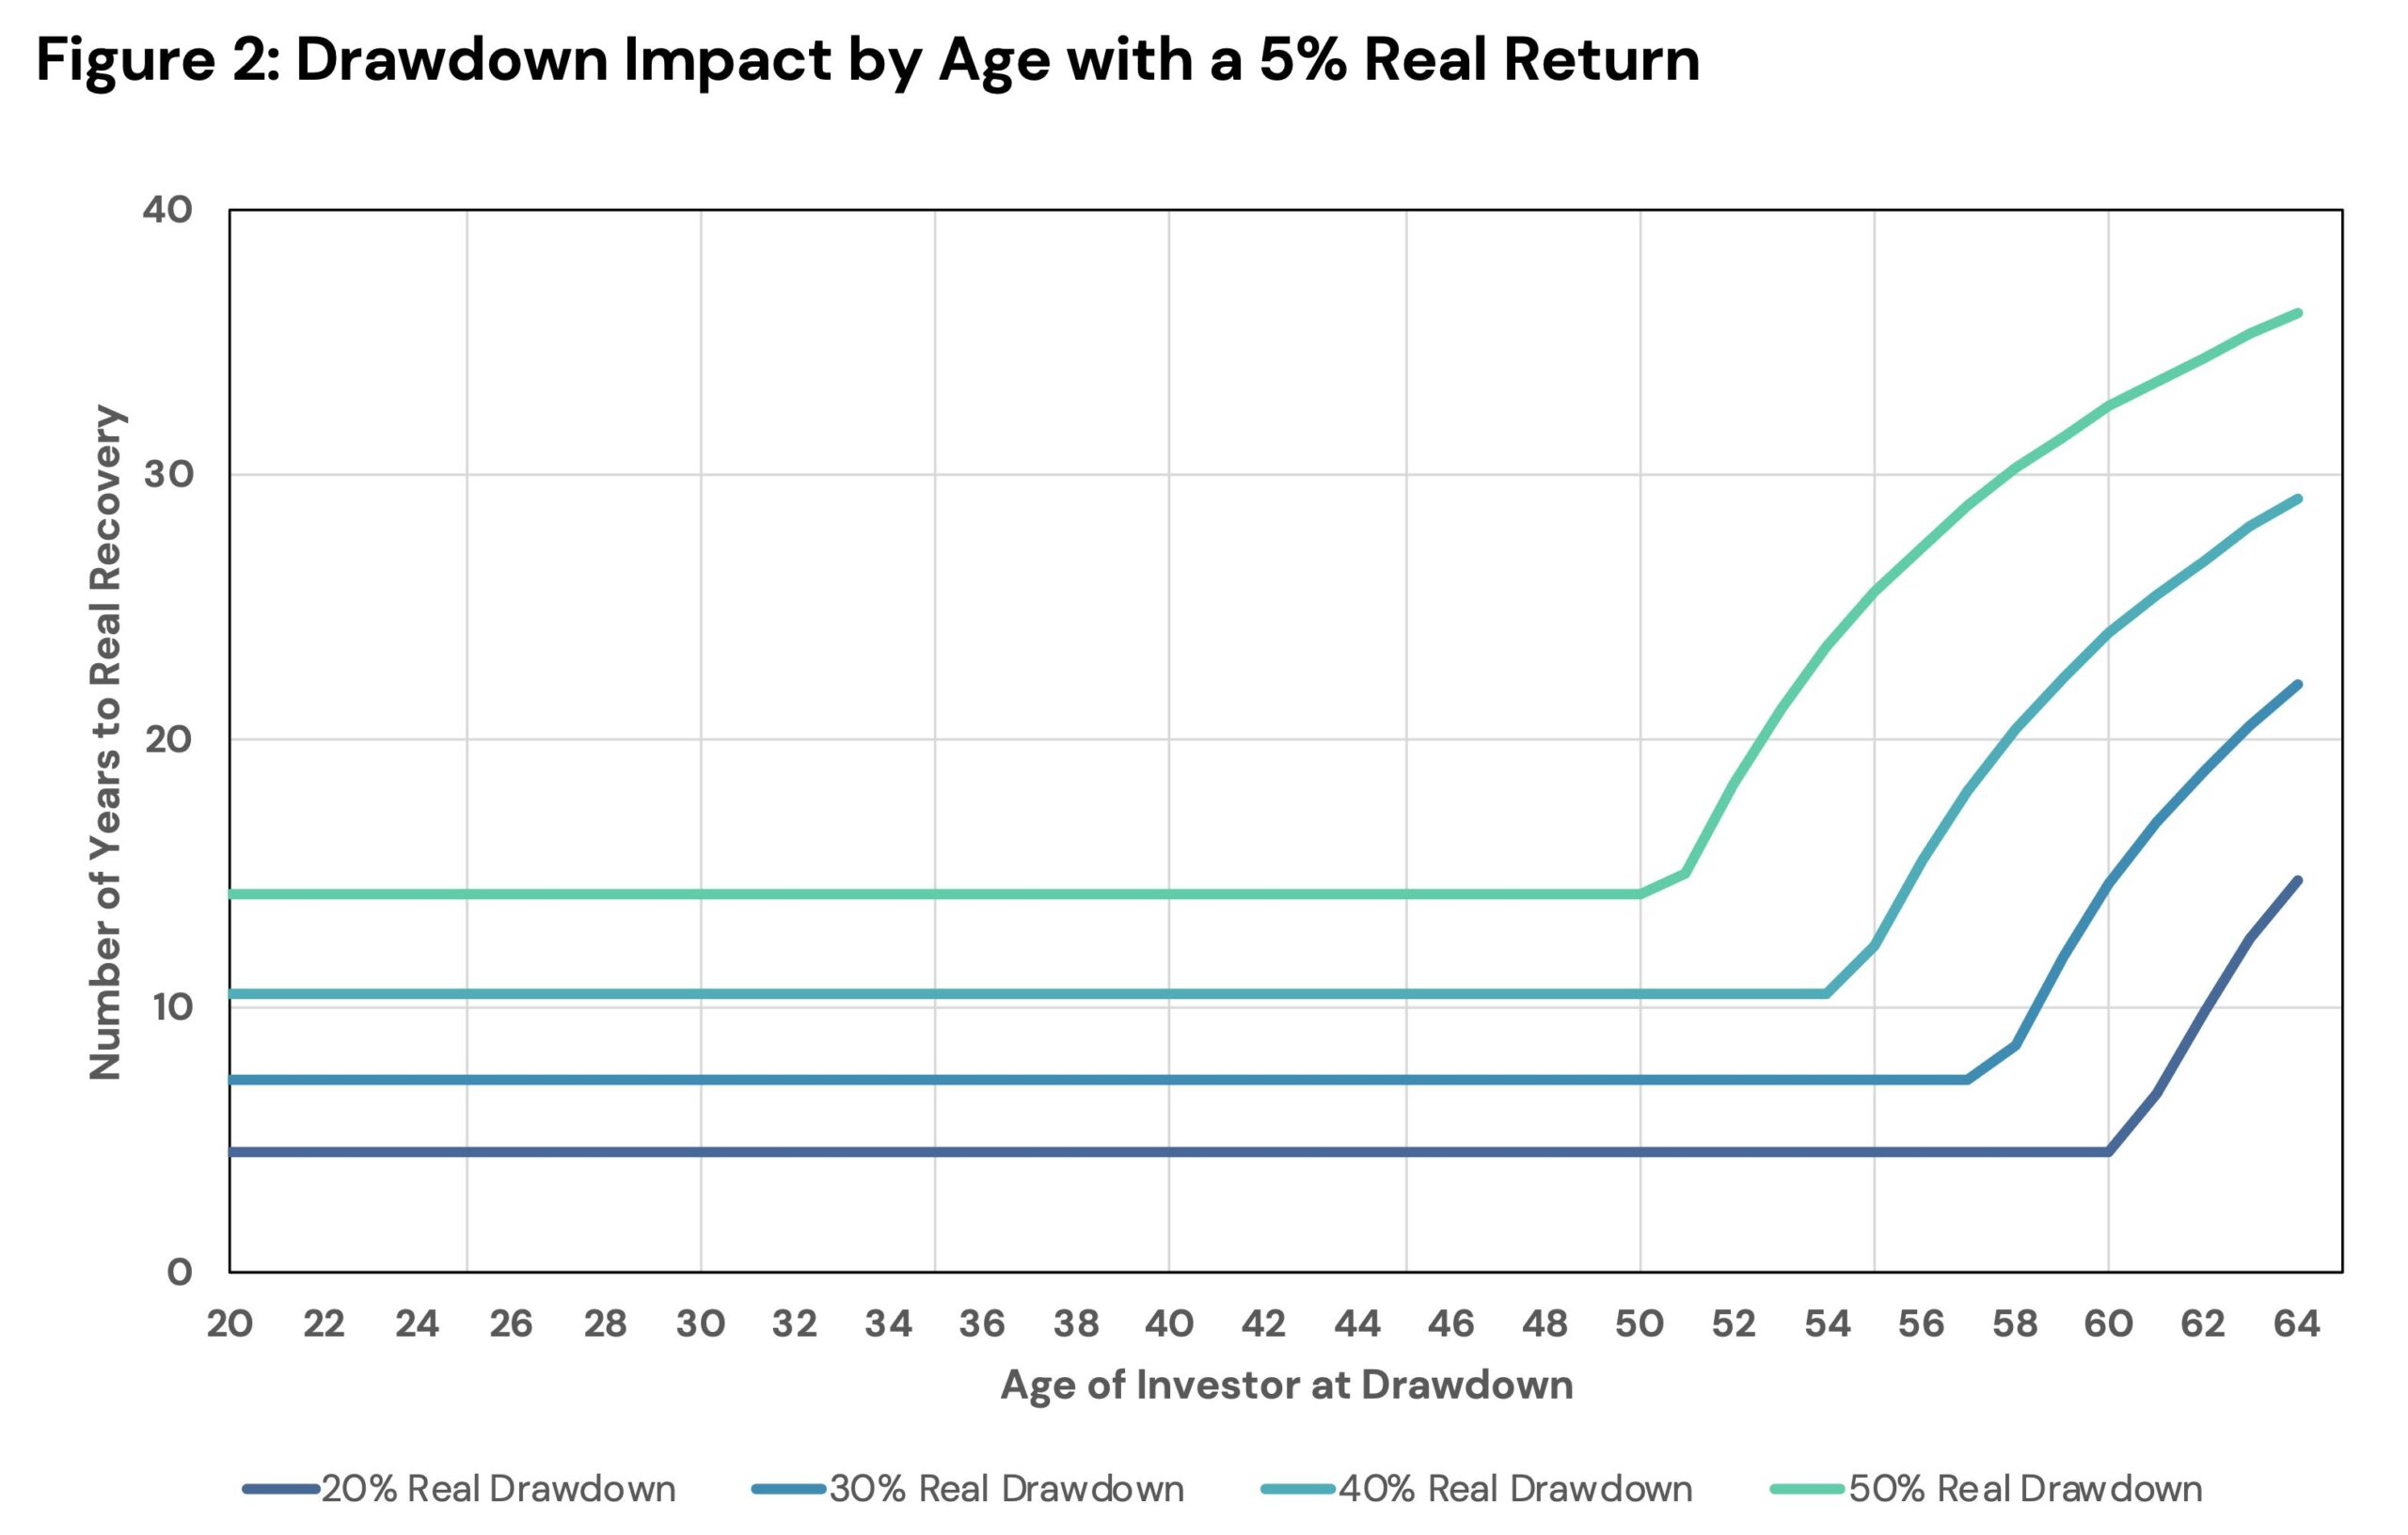
The retirement literature calls the 5 years either side of retirement the retirement risk zone: the window with the greatest influence on whether a plan survives.
This is where the 60/40’s inflation blind spot does its worst damage. An inflation shock can pull stocks and bonds down together while it erodes the real value of every dollar withdrawn. Inside the risk zone, that is the failure a retirement plan can least afford.
Adding Without Subtracting
One natural response is to add diversifying assets that do not share those same blind spots. But adding a diversifier to the 60/40 runs into a funding problem: the money allocated to the diversifier must come from selling existing stock or bond investments. Reducing equities gives up growth the investor still needs to hedge longevity risk; selling bonds gives up the ballast that works during growth shocks. In a 100% exposure portfolio, the net change must sum to zero.
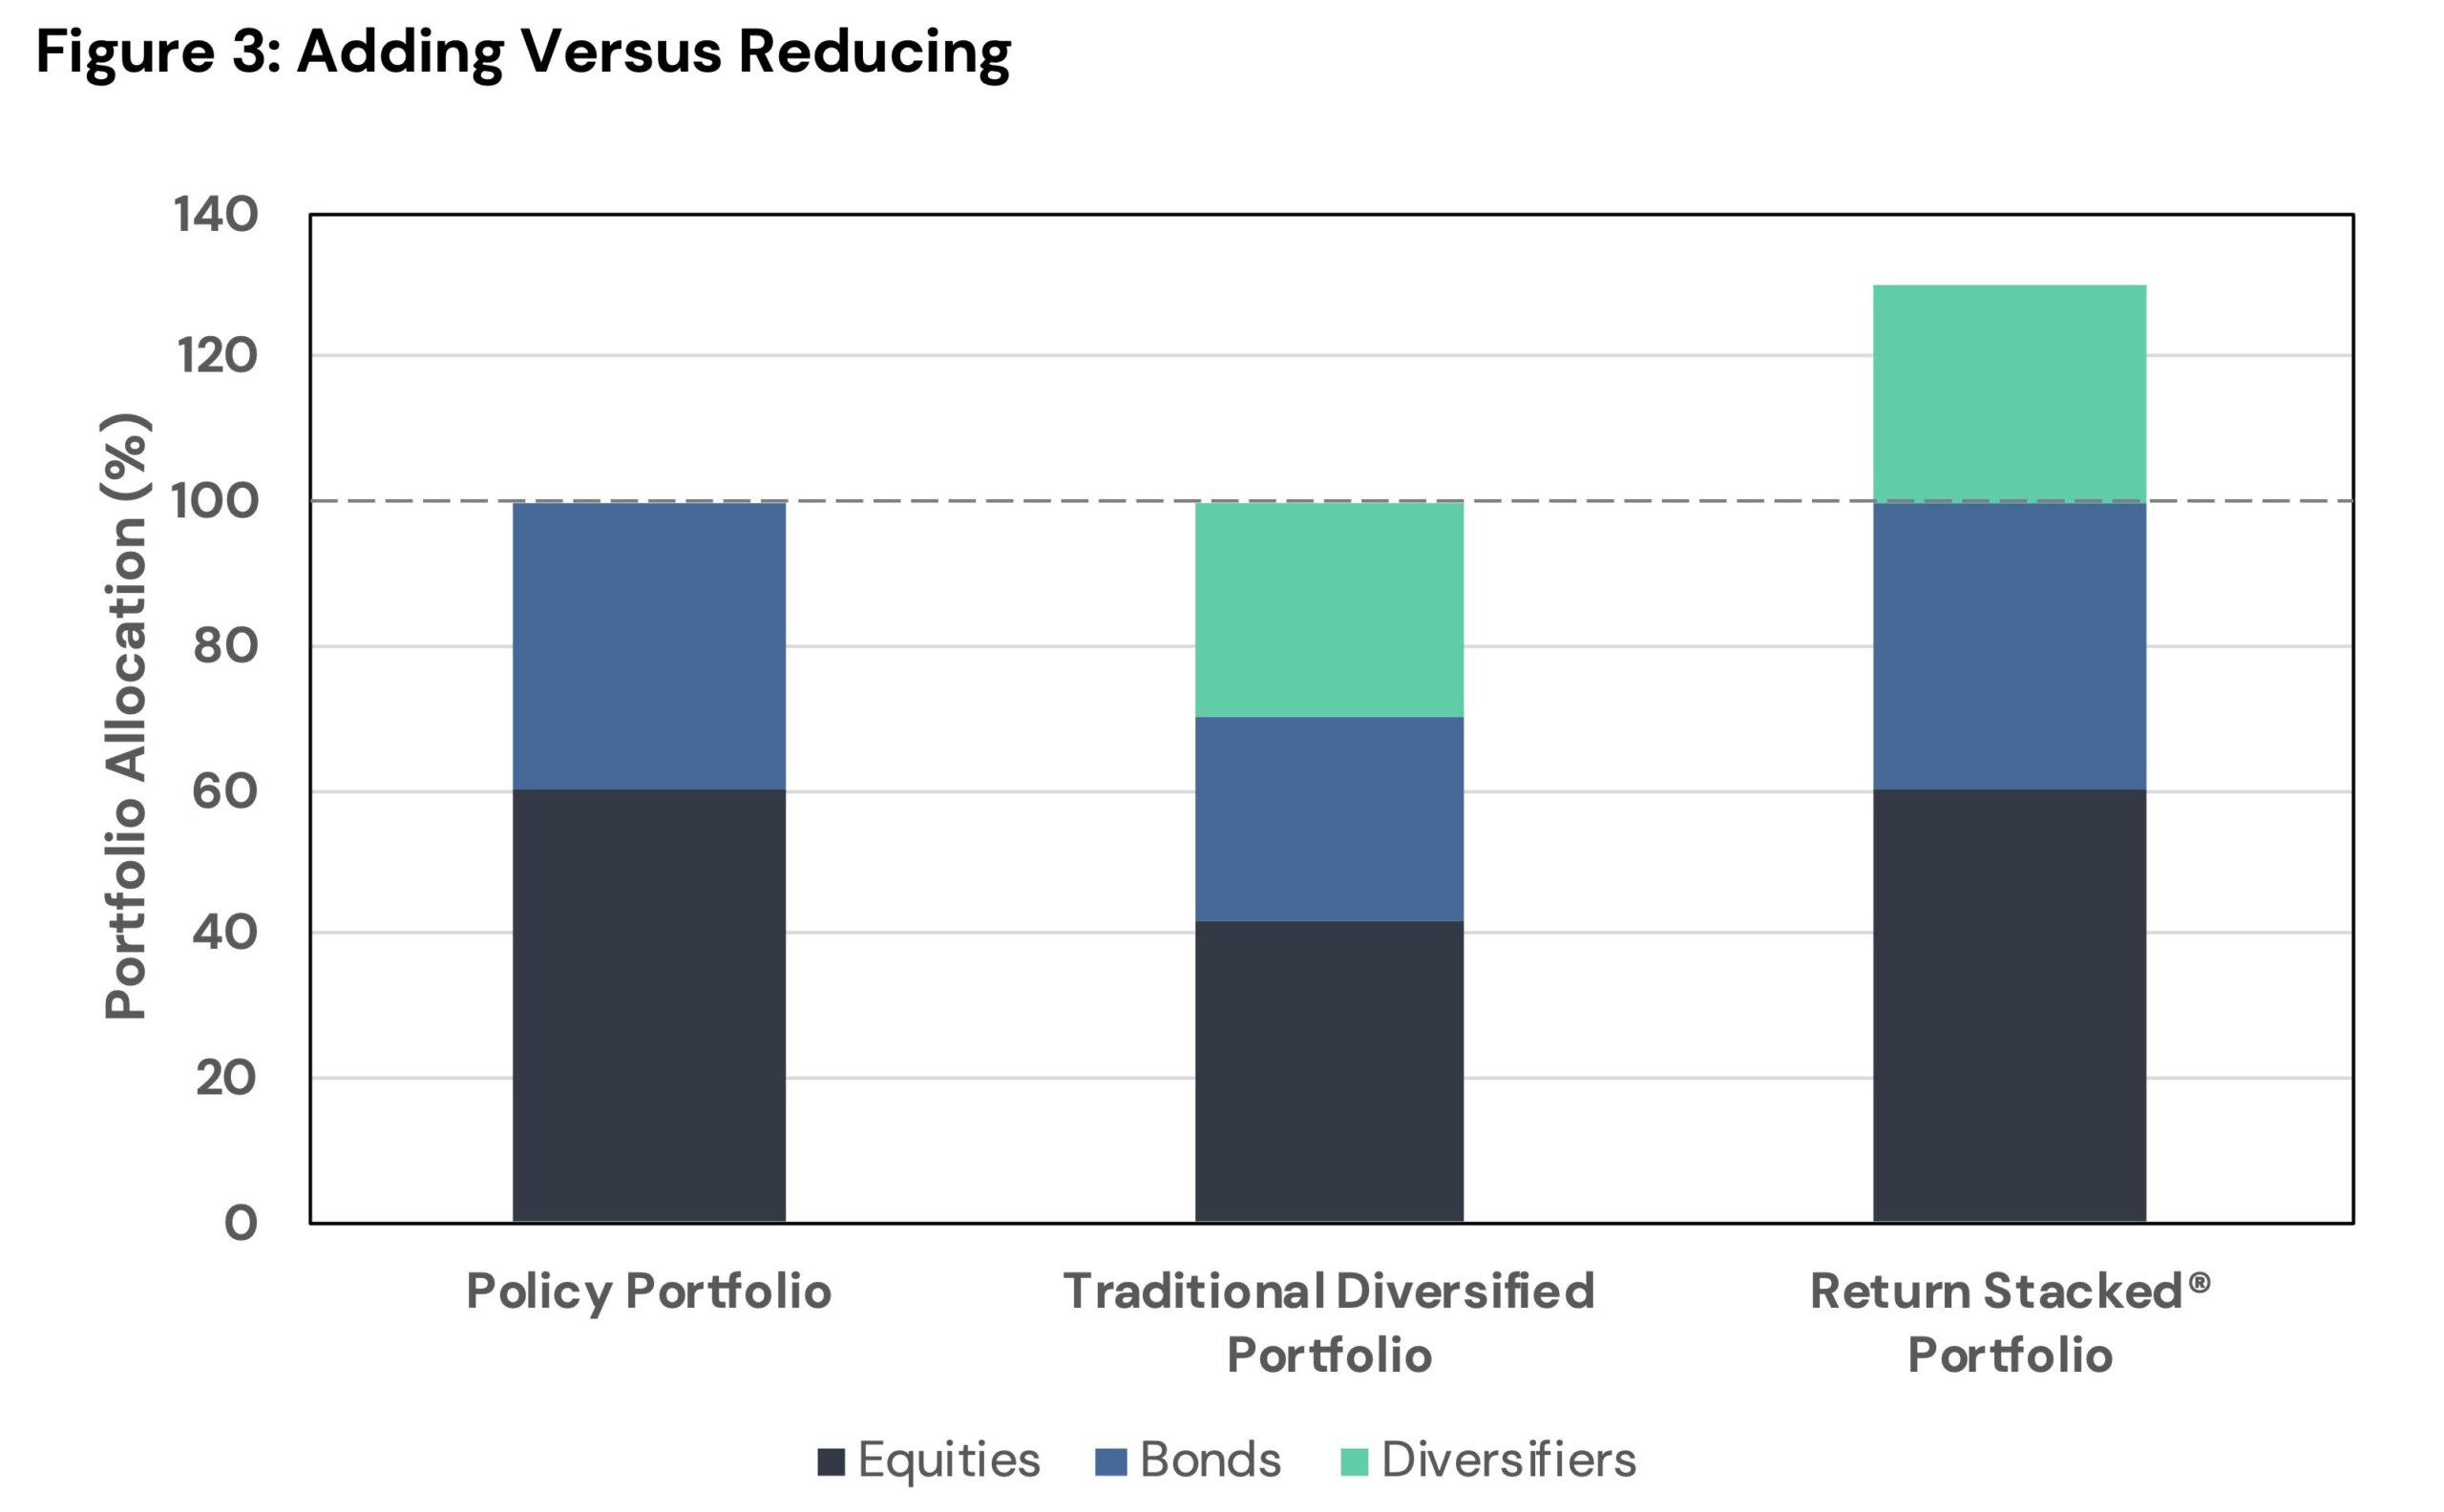
Return stacking removes the tradeoff. By holding part of the core stock and bond exposure through capital-efficient derivatives, a portfolio can keep its 60/40 intact and use the freed capital to layer diversifiers on top. This is a playbook institutions have run for decades under the name portable alpha.
The 60/40 can stay a 60/40 while the overlay adds to it rather than carving room out of it.
What goes on top can then aim to address what the 60/40 is missing. For example, trend following and gold have historically performed well in the inflationary and crisis regimes that hurt both 60/40 legs at once; meanwhile, merger arbitrage and futures yield (carry) seek absolute returns that do not depend on equity beta.
Optimizing Implementation
In adopting this approach, a primary question is how to size these stacks.
Raising expected returns is the easy part: just stack more. But more exposure can mean more risk and an investor nearing or at retirement may have little tolerance for that (either in capacity or appetite).
If risk is the concern, the sizing should start there. For a guiding answer, we turn to a resampled optimization. It repeats its search across thousands of simulated market histories and averages the winners, so no single history drives the result.
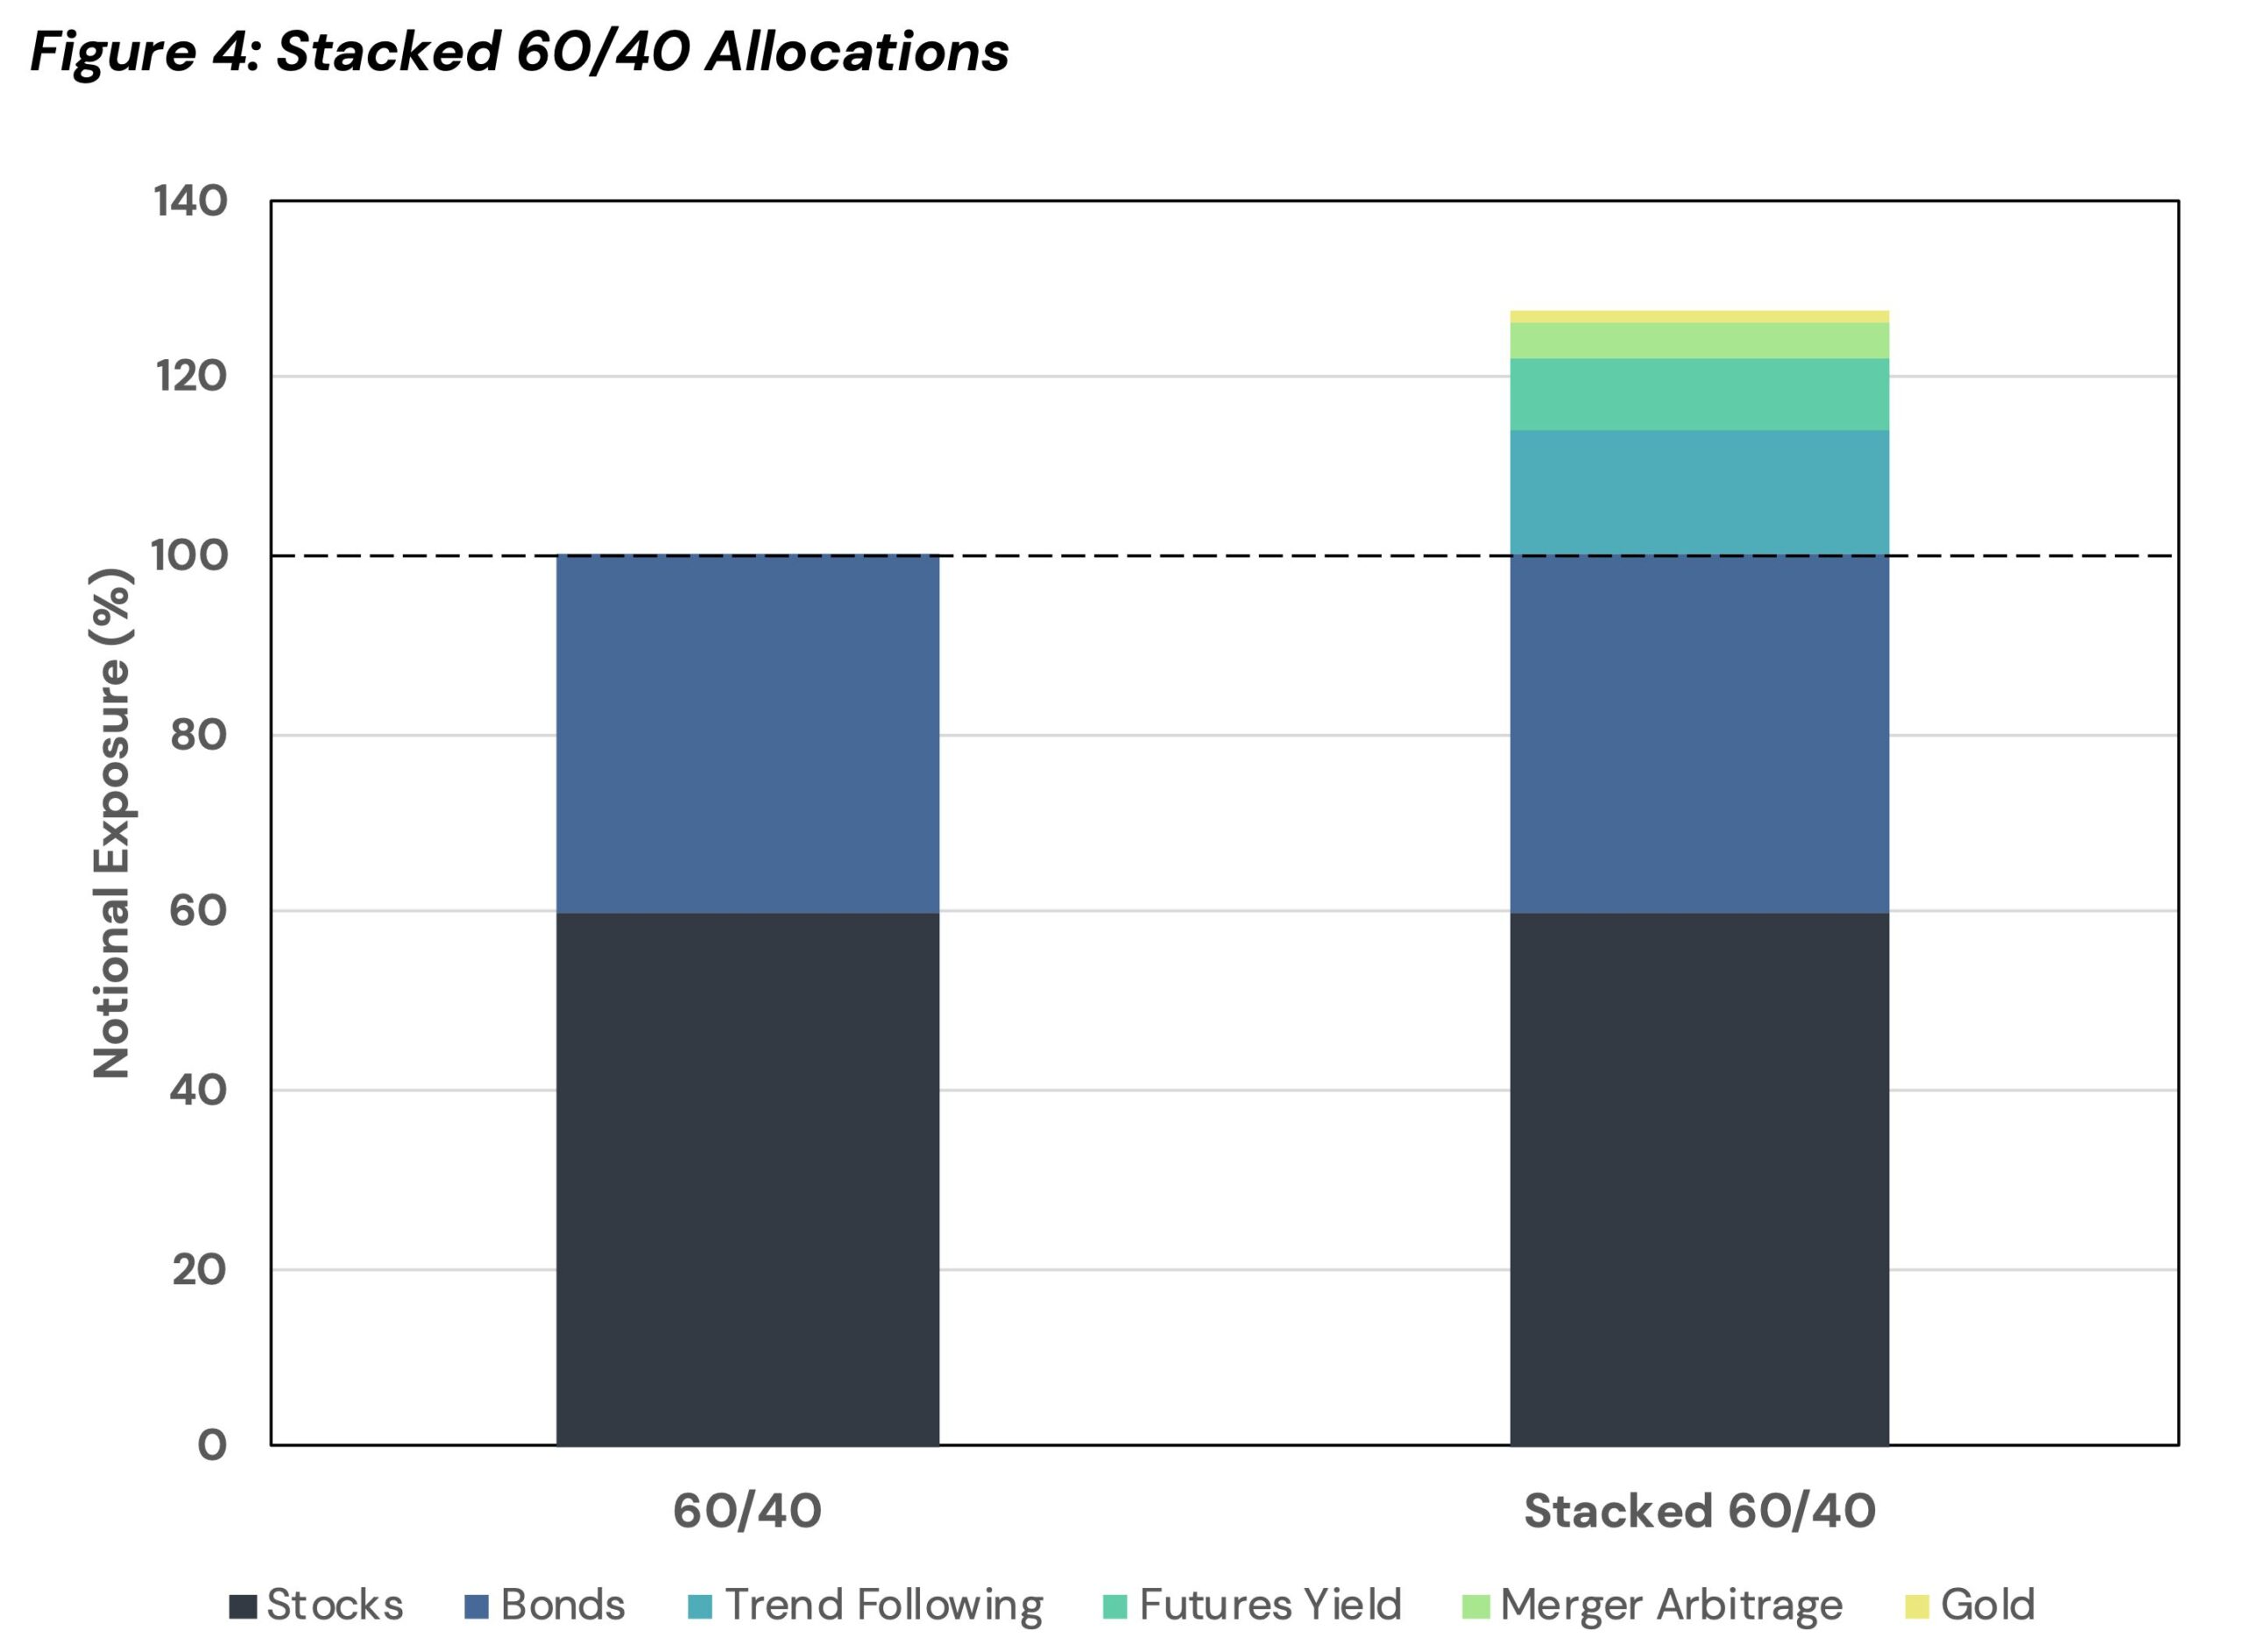
We constrain the search in two ways. The stacked portfolio’s volatility must stay near the original 60/40’s, and total notional exposure must stay below 130%. Within those limits, the optimization seeks the highest expected return.
The optimization stops short of the full budget, settling at a 27.6% overlay: 14.2% trend following, 7.8% futures yield, 4.0% merger arbitrage, and 1.6% gold. The result, shown in Figure 4, is the same 60/40 carrying 127.6% in total notional exposure.
To assess how this overlay impacts a retirement plan, we simulate 2,000 retirement worlds by block-resampling monthly returns from 2000 through 2026 where each asset is recentered on a conservative forward-looking Sharpe ratio rather than its historical mean.
In each world the retiree holds the 60/40 from age 60 to 95, retires at 65, and withdraws 4% of age-65 wealth every year, adjusted by inflation[1]. Wealth is indexed to 100 at age 60 with no contributions, so every difference between the portfolios is strictly a portfolio effect.
Before Retirement: Arriving at 65 with More
The five years before retirement are the most consequential accumulation years the investor has left. Whatever the portfolio is worth at 65 sets the withdrawal for every year that follows.
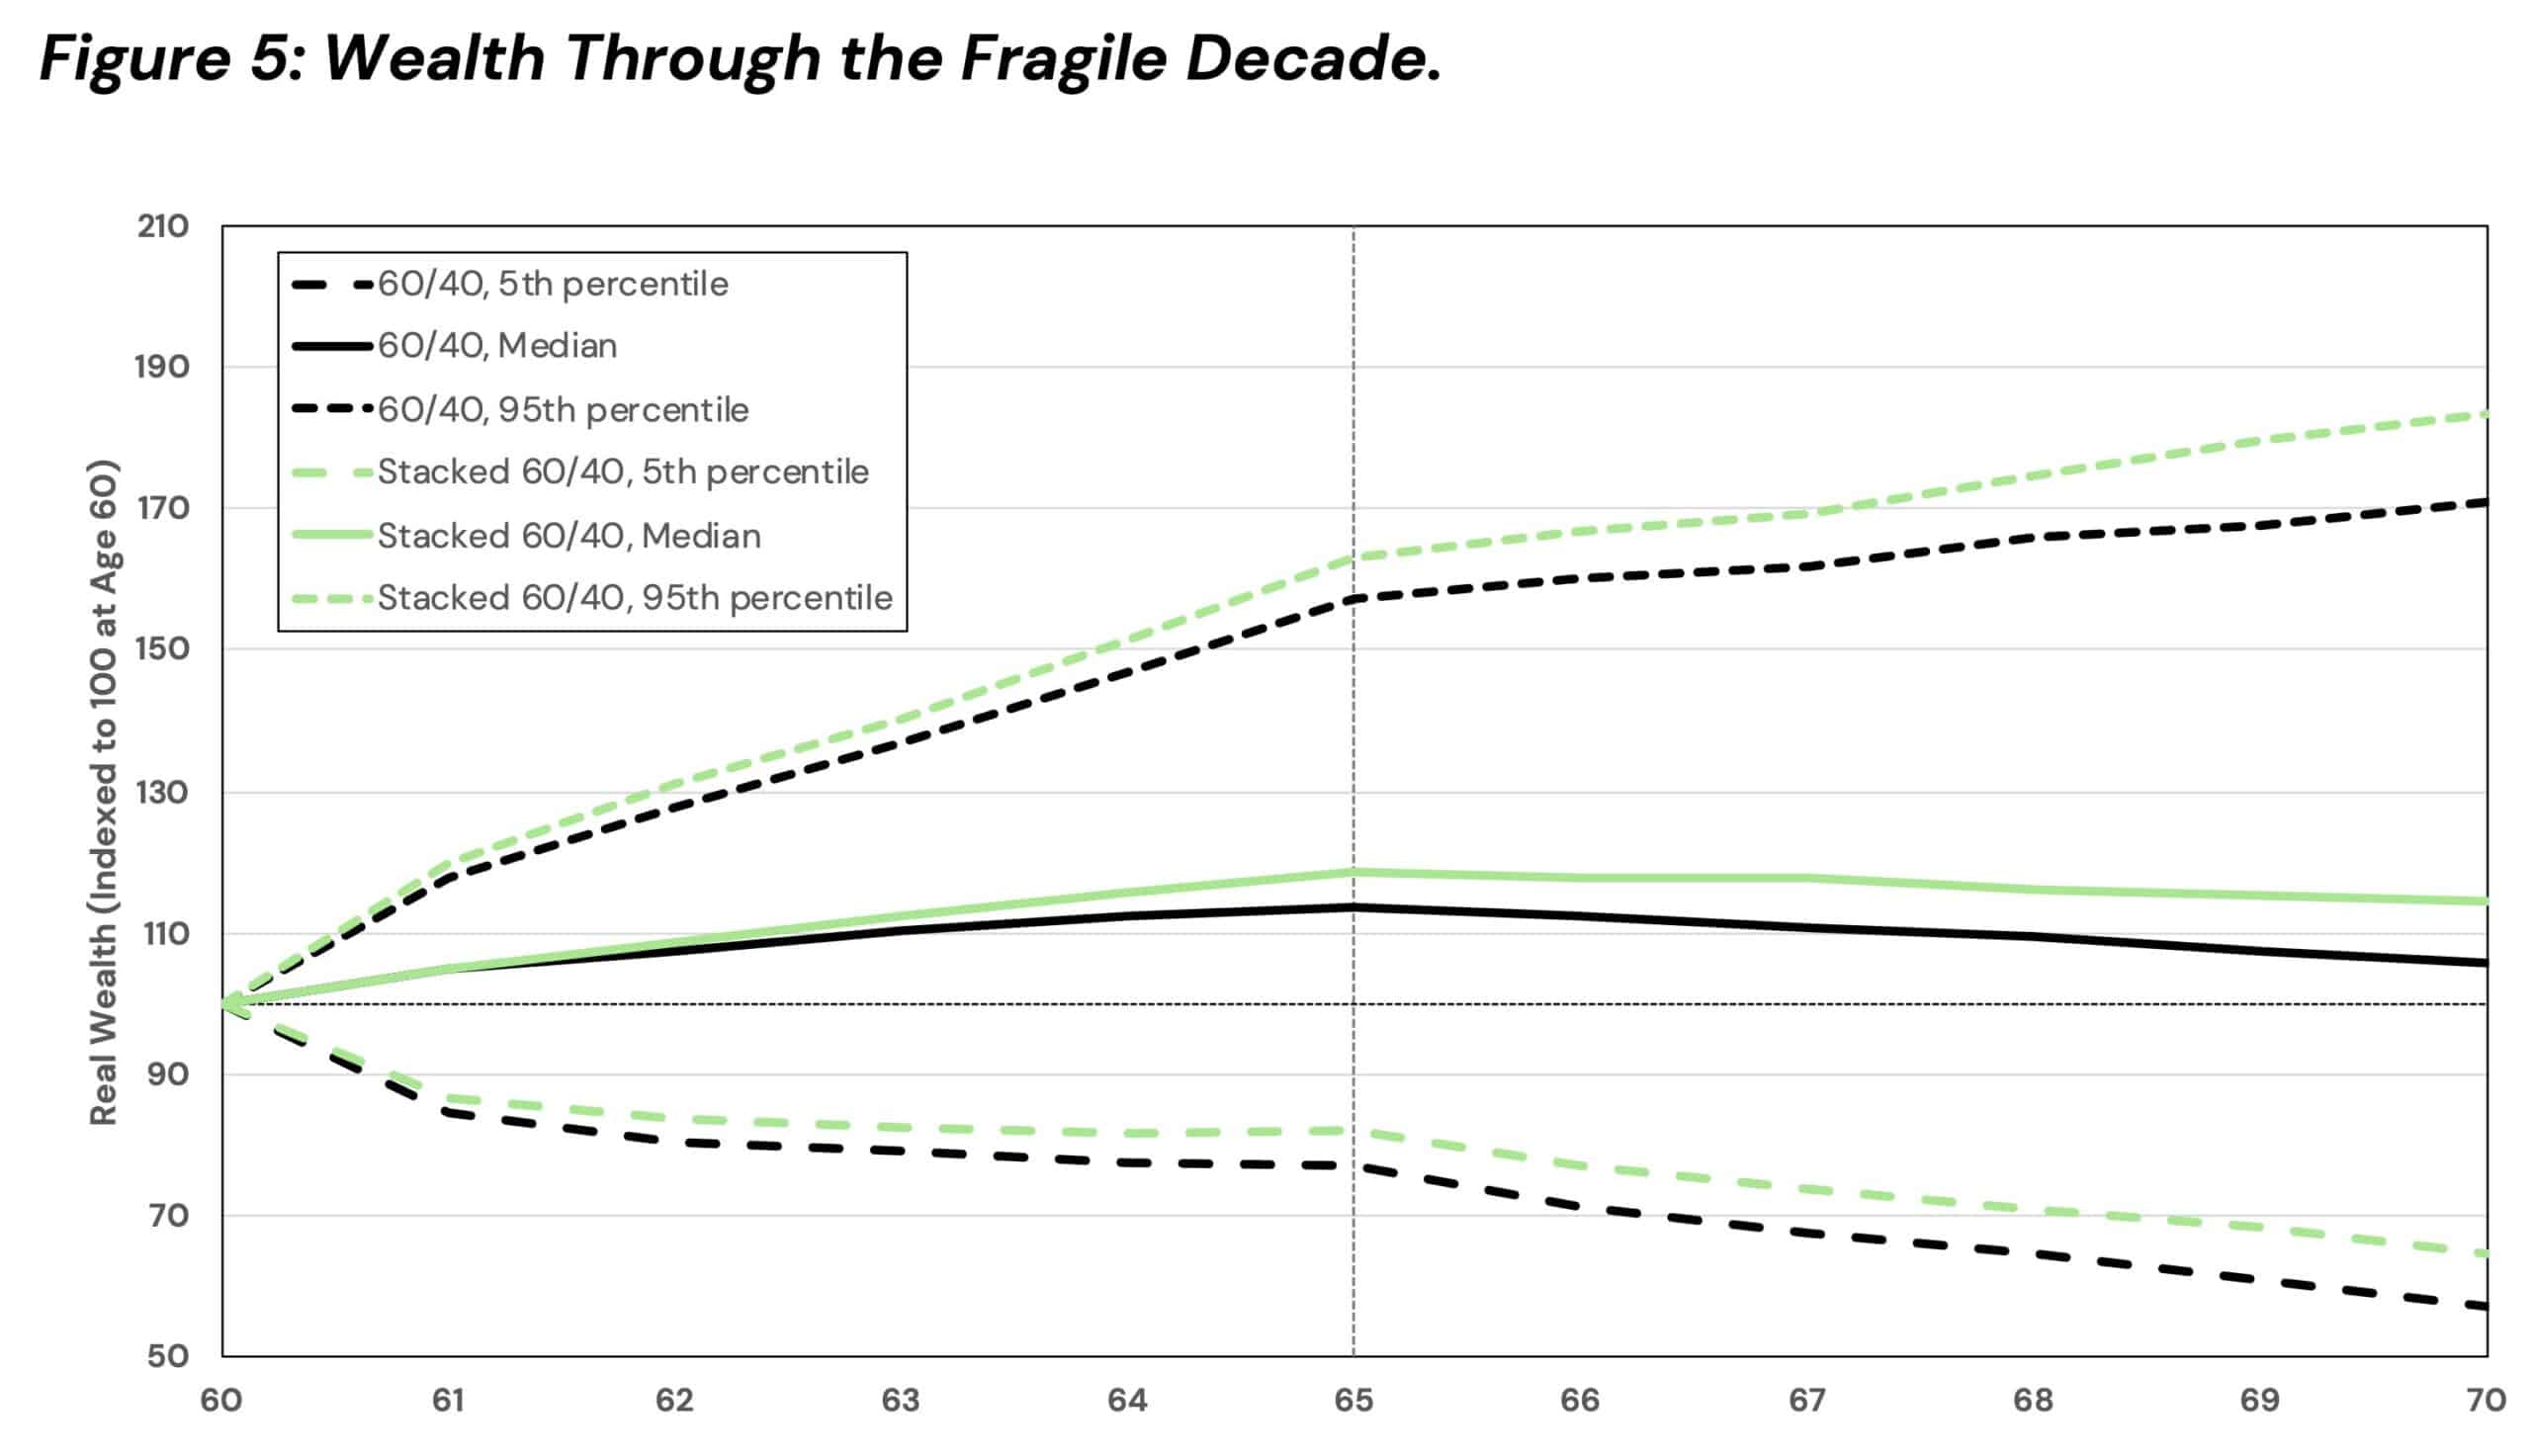
In the median outcome[2], the stacked portfolio outgrew the bare 60/40 by five percentage points over those five pre-retirement years and crossed the standard portfolio’s age-65 wealth about a year and a half early.
The tails matter just as much. An unlucky retiree locks in a withdrawal off a diminished base. Even in the 5th percentile outcome, the stacked portfolio lost less: 18.0% in real terms against 22.8% for the 60/40.
After Retirement: Surviving the Sequence
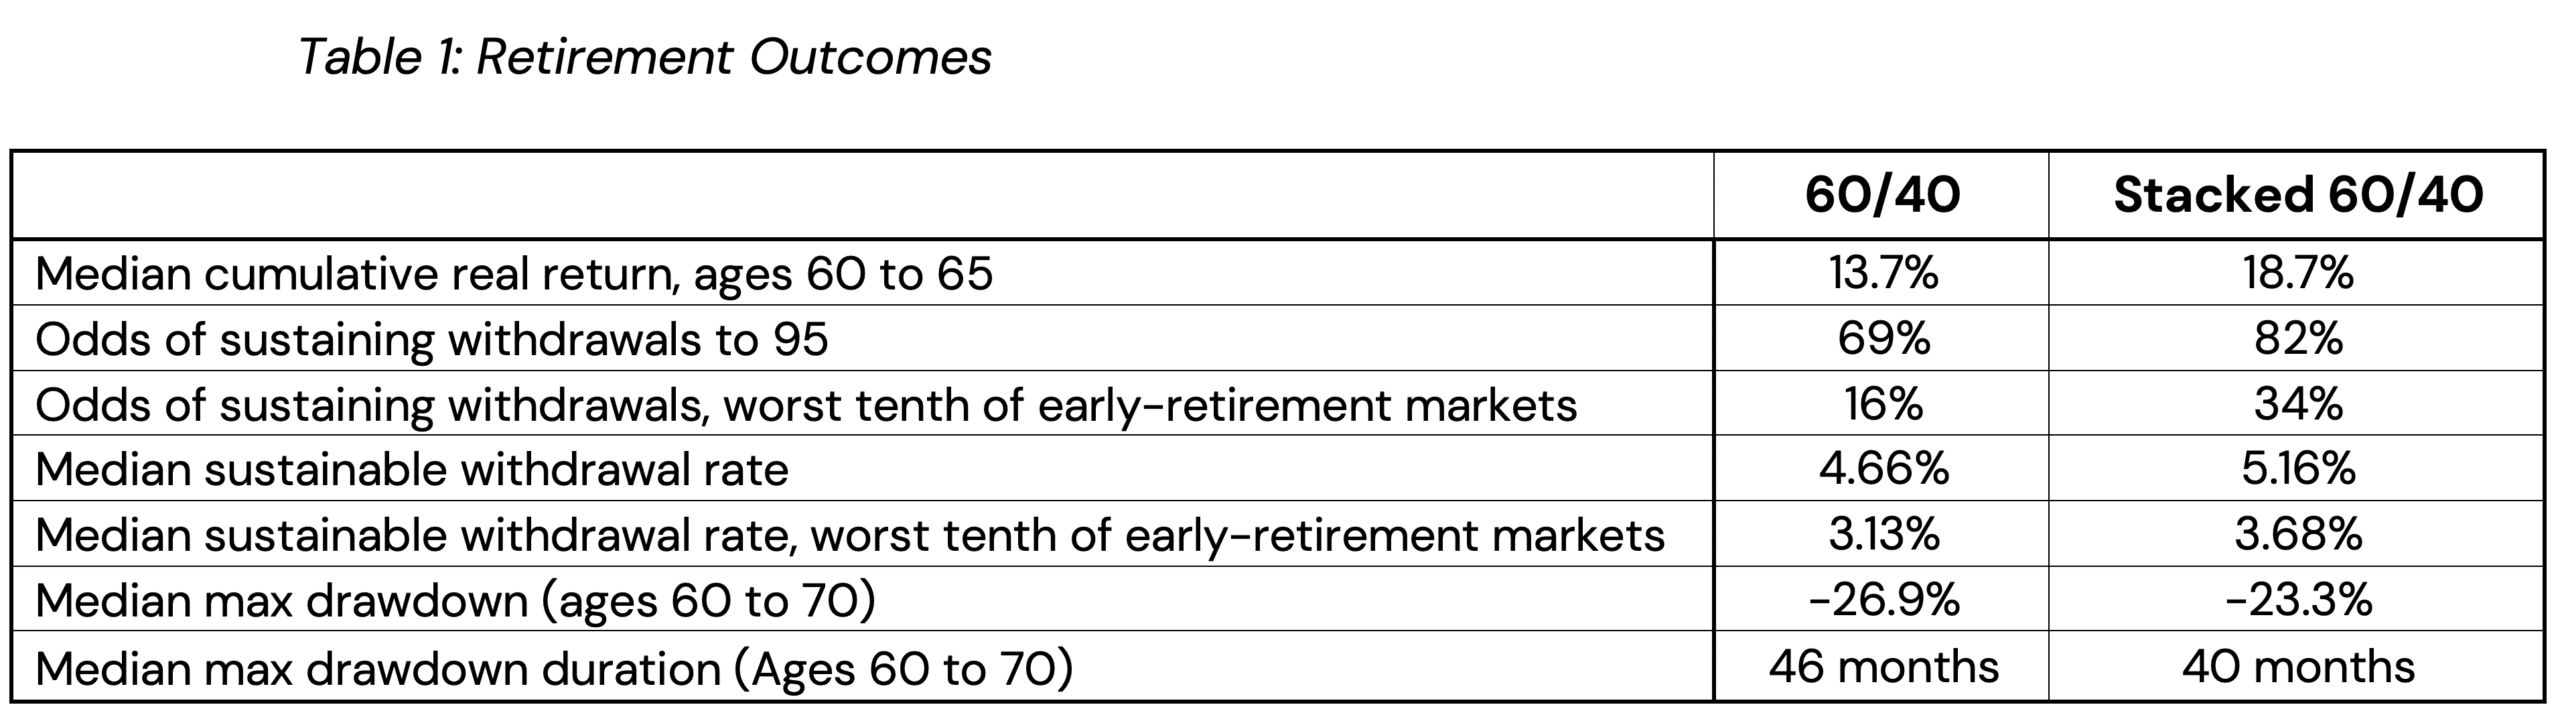
Across all simulations, stacking lifted the odds of sustaining withdrawals to age 95 from 69% to 82% and raised the median sustainable withdrawal rate from the 60/40’s 4.66% to 5.16%.
The harder test comes when the first years of retirement go badly.
When we sort the simulations on real equity returns from ages 65 to 70 and look inside the worst tenth, neither portfolio fared well. The bare 60/40 sustained its withdrawals in barely one retirement in six, and even with the overlay, two retirements in three still failed.
The odds of getting through nonetheless doubled, and the withdrawal rate those markets could support was higher as well. In these worlds the overlay did not merely postpone ruin, it converted failed retirements into funded ones.
The overlay also preserved capital along the way. Five years into a worst-decile retirement, the median stacked portfolio still held 77% of its age-60 wealth, against 66% for the bare 60/40.
Across all simulations, the median wealth remaining at 95 more than doubled, from 32% of age-60 wealth to 69%.
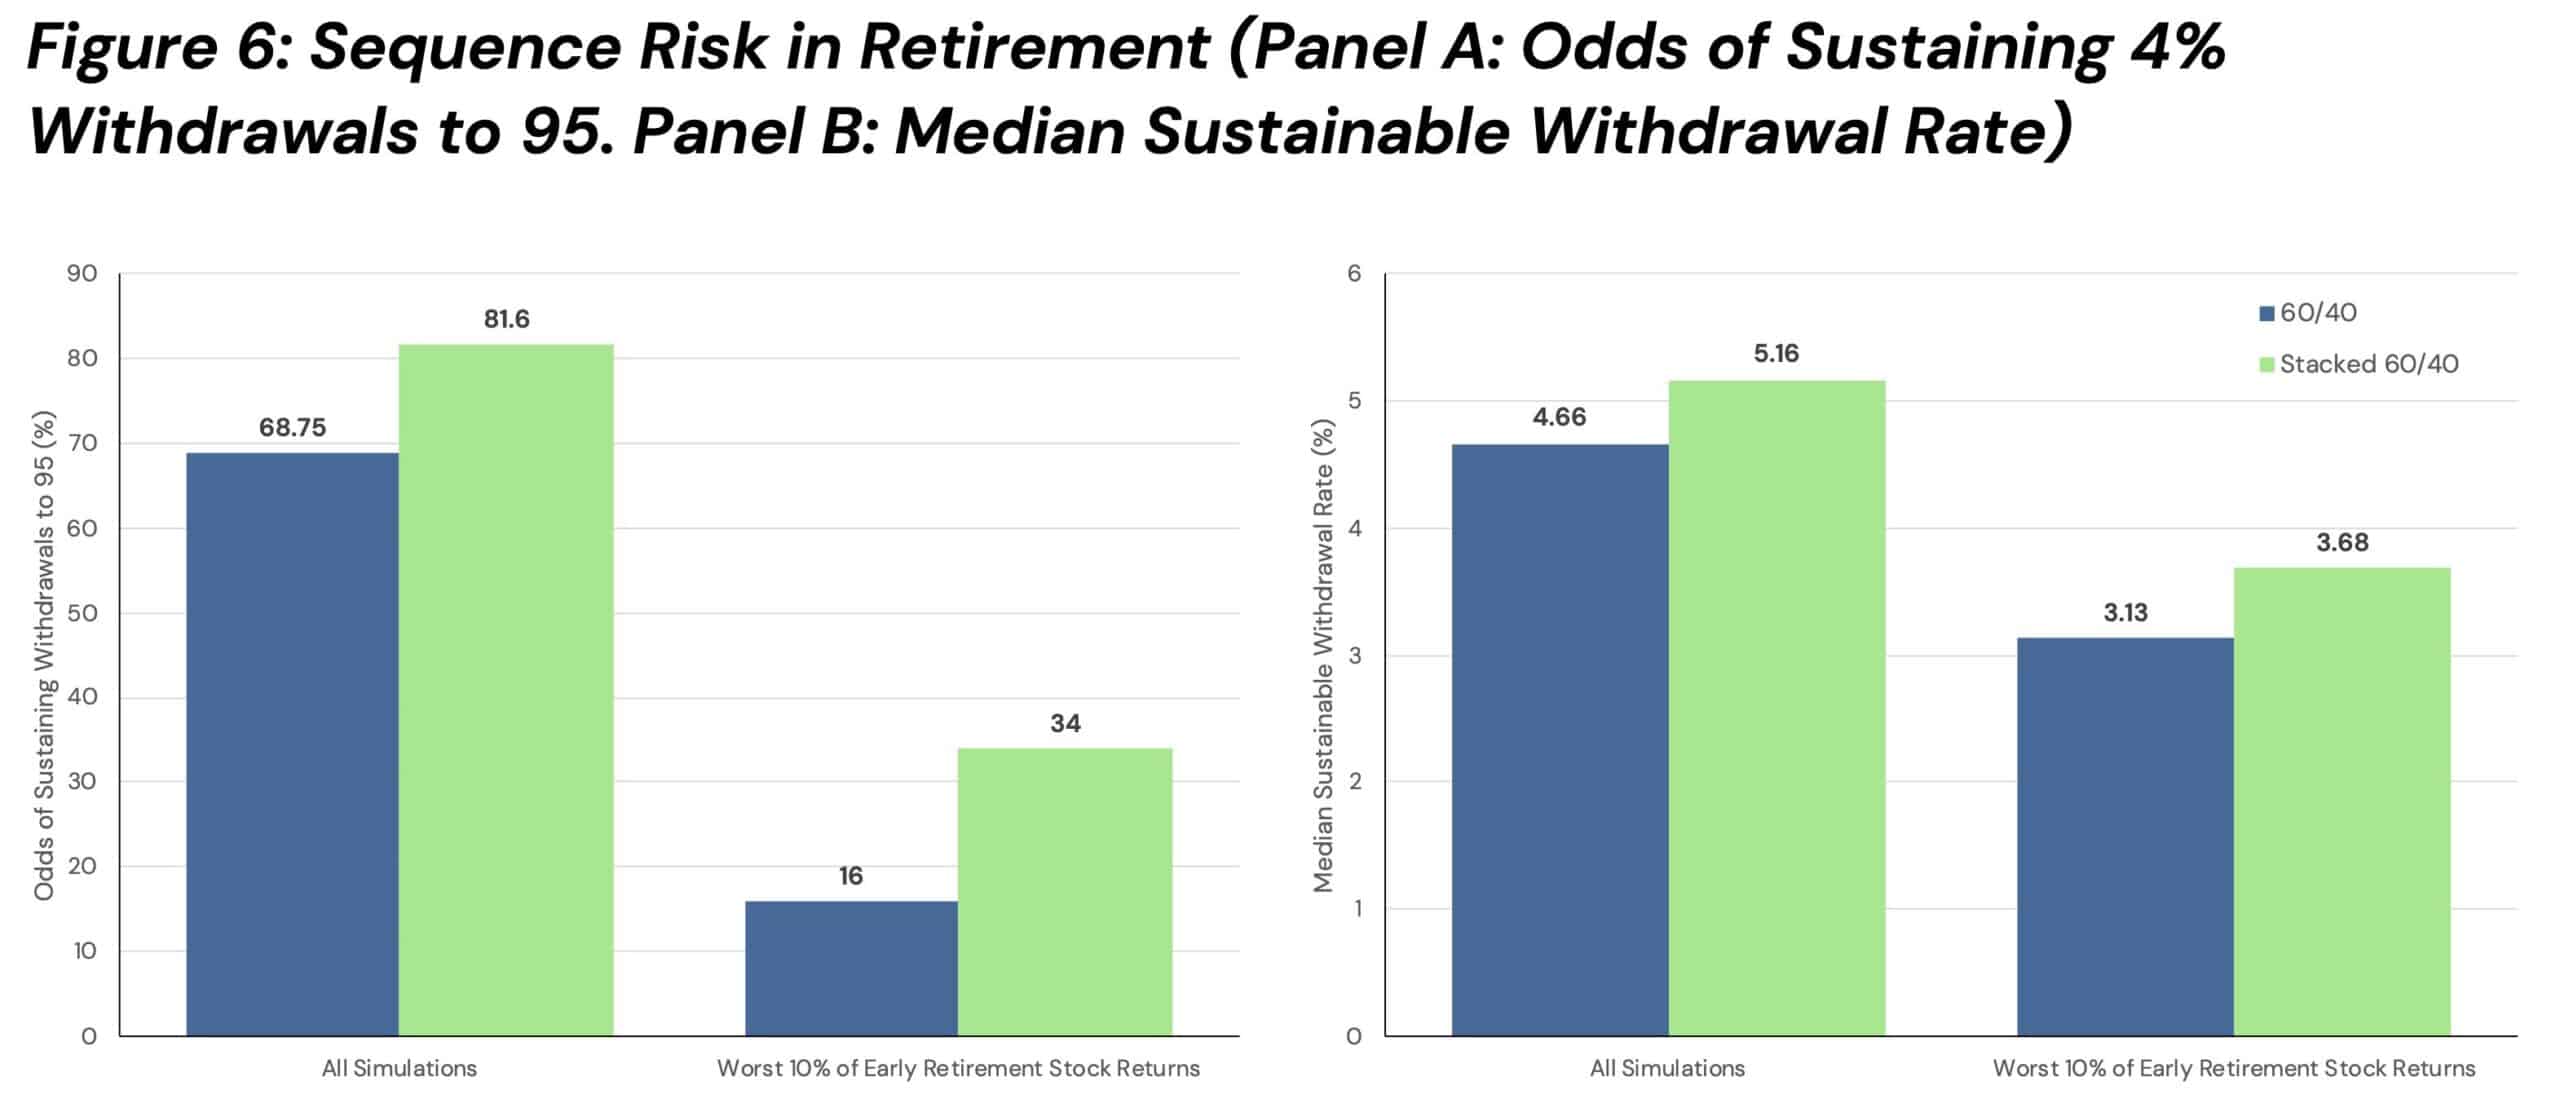
Interestingly, the outcomes did not come at the cost of more risk. From age 60 to 70, the stacked portfolio’s worst drawdown was typically shallower than the bare 60/40’s. It also spent less time below its prior peak: a median of 40 months, versus 46 for the 60/40.
Rethinking Means Reinforcing
Nothing here guarantees retirement success. The overlay did not rescue the worst retirement plans and no investment allocation can promise success. What it did change was the distribution of outcomes. The retiree had a better chance of arriving at 65 with more and of sustaining the withdrawal if the early years turn hostile. And when markets cooperate, stacking means more may be left at the end of retirement.
Challenging the 60/40 does not have to mean abandoning it. Return stacking keeps the core intact and layers diversifiers on top, so the period least able to absorb a shock gets the reinforcement it needs.
In the decade when the odds matter most, it is a way of stacking them in the retiree’s favor.
Methodology: We simulate 2,000 return histories with a stationary block bootstrap. The bootstrap draws joint monthly index returns from January 2000 through April 2026, with an average block length of 12 months. Whole months are drawn together, which preserves cross-asset correlations. We adjust each asset’s simulated mean so that its Sharpe ratio matches our forward assumptions: 0.30 for stocks, bonds, trend following, and futures yield; 0.20 for gold; and 0.50 for merger arbitrage. Volatilities and correlations come from the historical sample. We finance overlay exposures at the T-bill rate plus 50 basis points. In each simulated history, an optimization finds the overlay mix that maximizes return with two constraints: gross notional exposure stays at or below 130%, and portfolio volatility stays within 5% of the bare 60/40’s in relative terms.
Important Information
This material is for informational and educational purposes only and is intended for use by investment professionals. It is not intended as investment advice or as a recommendation to buy or sell any security or to adopt any investment strategy. The views expressed are those of the authors as of the date of publication and are subject to change without notice.
Return stacking may involve the use of derivatives, leverage, and short selling, each of which may increase potential losses and risk.
