By Linus Nilsson, Head of Systematic Strategies at Tidan Capital: One of the mythical qualities of a trend-based strategy is that it is a strategy with a positive Skew, which measures the asymmetry of the returns. It is not always trivial to interpret, depending on the actual shape of the distribution.
In layman’s terms, skewness suggests a distribution with occasional large gains and relatively smaller losses, whereas negative skewness indicates the opposite: steady gains punctuated by rare but severe losses. In technical terms, it is the third standardized moment. Skew is not a return measure, only a description of the return distribution.
Skew describes the asymmetry of the shape of the distribution. Positive Skew is the tendency to see larger positive returns and smaller negative returns. Negative Skew is the tendency to observe larger negative observations and smaller positive gains.
The return distribution of a trend strategy is expected to have a ‘fatter’ right tail. But maybe not always in the way investors expect.
During the golden days of Hedge Funds (pre-2008), this was an argument often used to motivate an increased allocation to Managed Futures strategies. Especially as other Hedge Fund strategies exhibited negative Skew.
Expecting a positive Skew from momentum-based strategies is reasonable on a trade-by-trade basis, i.e. when looking at the return of individual trades, entry to exit. As we will show, it is not true when looking at the daily portfolio returns and seems to get worse over time. We build our own trend replication strategies, and we also look at a few of the daily indices that are available.
As an investor and a trader, we know that CTA strategies often have large negative daily returns. Something that can come as a shock to investors.
Trade by Trade statistics are seldom available or even of interest to the individual investor. If a manager has an extraordinary multiyear trade in Cocoa, Sugar, or Coffee it is great for the total return, but does not generally change the shape of the observable distribution.
The Term Structure of Skew
As an illustrative Trend Strategy, we build a standardized breakout strategy. We use a portfolio of 86 liquid futures, diversified over Equities, Fixed Income, Currencies, and Commodities. Over this portfolio, we apply a breakout strategy with a variable lookback. We start with 2 days and run this strategy all the way up to 256 days, creating 15 different return streams.
The distance between lookbacks is based on the square root of 2. While this may seem overly specific, this also ensures that we have a reasonable degree of diversification between two adjacent portfolios.
The breakout strategy buys higher highs and sells lower lows, as measured over the last N days.
The average holding periods here range from a week to close to two years. Breakouts are easy to conceptualize, and the results generally hold for other common measures of trend direction. The shorter breakout typically does not have positive (simulated) returns, partly illustrating that markets have different behaviors over longer and shorter horizons.
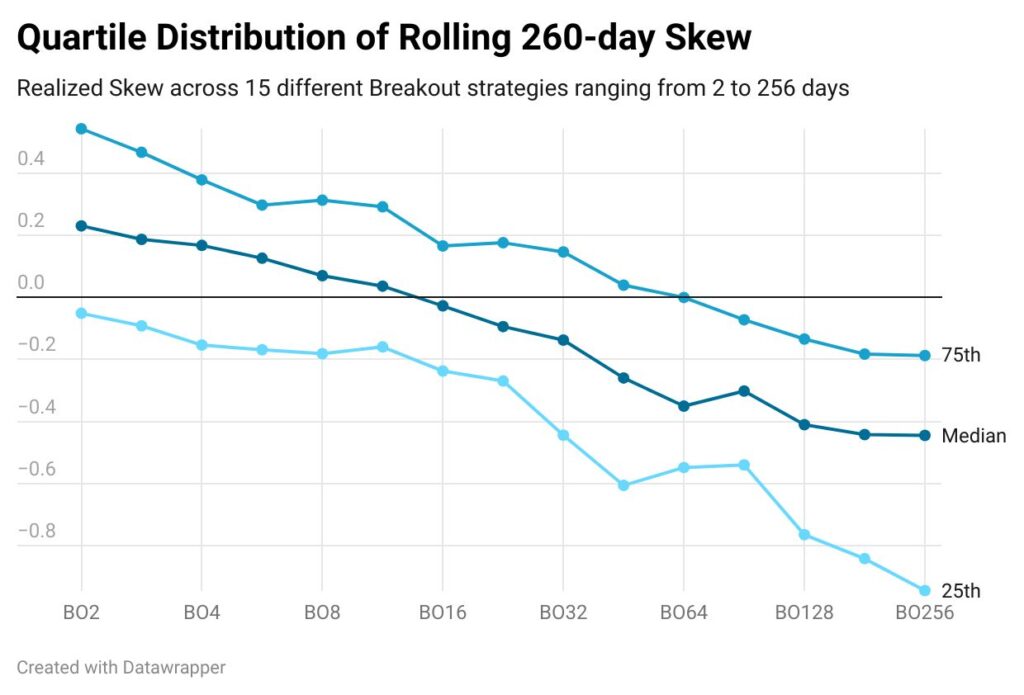
We calculate the rolling yearly daily skew of the strategy, highlight the median skew, and the upper and lower quartiles. We can verify some earlier academic results, i.e. the term structure of skew is downward sloping for momentum strategies. The longer the holding period, the more negative skew we realize, and vice versa.
To ensure that this is not an artifact of daily returns, we run the same calculations using monthly data. The results hold, with a downward sloping Skew term structure, but the best monthly skew is obtained for the 4-day breakout strategy, creating a slightly humped term structure. Skew turns negative on a 64-day breakout horizon rather than the 16-day breakout using daily data. Monthly returns hide a lot.
Reality Check
As a quick reality check, we calculate the average daily skew of the two fastest breakout strategies (2 and 3 days) and the two longest (181 and 256 days). We compare this to the skew of a composite of different daily CTA indices.
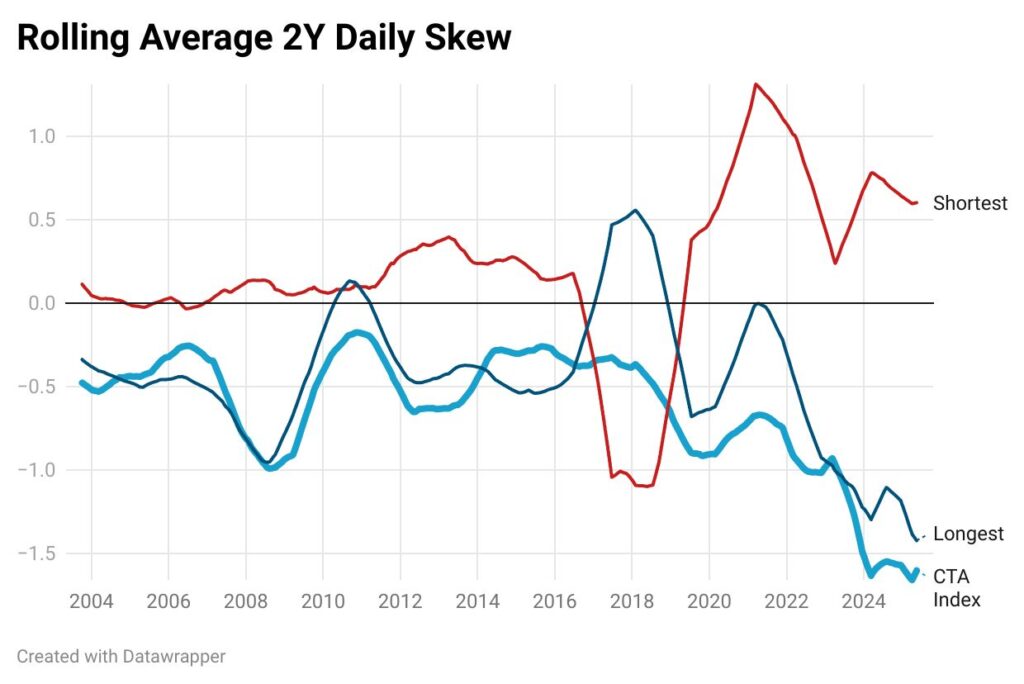
A trivial observation is that with a brief exception of an episode during 2017-2019, faster momentum strategies realized a larger positive skew. The realized Skew for shorter strategies is increasing since Covid. On the contrary, longer-term strategies have realized a negative skew, with a few exceptions. It is also getting increasingly negative.
As our Breakout strategies are not ‘real’ CTAs, we calculate the same statistics based on daily returns from large CTAs. We note that this ratio is getting increasingly negative, and even more negative than what would be indicated by Breakout strategies that hold positions for years.
As a side note, there are some other tricks that can achieve a higher positive skew for trend strategies. For instance, continuously adding exposure to an existing trend position. If the trend continues, the portfolios get increasingly exposed to a trend with strong positive drifts. That said, it is occasionally a bit difficult to combine with a sound risk management policy.
Summary
While Skew may seem to be an esoteric measure, it has often been used as an argument for why Trend Following strategies should be included in a portfolio, i.e. the chance of obtaining large positive returns during market dislocations.
Our analysis also shows that the choice of time frame tends to influence Skew. Shorter-term momentum strategies tend to exhibit more persistent positive Skew over time and do not suffer from a similar deterioration over the last five years. Other short-term strategies may have completely different skew properties. This result for such strategies is however outside the scope of this short article.
The term structure of Skew is not a new observation and has been raised in previous academic and industry papers. The recent decreased Skew for Managed Futures managers could mean several different things:
- Large managers are often involved in crowded trades, suffering larger negative returns when positions are liquidated.
- Managers are more often exposed to markets with an inherent negative skew. An example here would be an increased exposure to long equity or short volatility positions that tend to be negatively skewed. There is nothing wrong with this exposure, but they may imply a different dynamic than expected.
- Trend Managers have gradually gravitated towards slower and slower trading strategies. If nothing else, this typically increases capacity.
This article features in the “Systematic Strategies and Quant Trading” publication below: