Partner Content (CME Group -By Blu Putnam, Chief Economist) – The research views expressed herein are those of the author and do not necessarily represent the views of CME Group or its affiliates. All examples in this presentation are hypothetical interpretations of situations and are used for explanation purposes only. This report and the information herein should not be considered investment advice or the results of actual market experience.
The pandemic of 2020 has brought extraordinary challenges to individuals, companies, and governments. The process has been dynamic as governments have imposed public health restrictions on movements and commerce, consumers have adjusted their behavior and businesses have coped with governmental restrictions and changes in consumer spending patterns. Monitoring the developments in the economy in real-time is important as the pandemic shifts course and governments, consumers, and businesses react to the changing dynamics. Moreover, the pandemic has altered some consumer and business behavioral patterns in major and likely long-lasting ways, and it is critical to track these behavioral changes and assess whether they could last or whether there will be a return to pre-pandemic habits and patterns.
Tracking the economy with traditional economic data, such as employment situation report, retail sales, inflation, real GDP, etc., simply is not sufficient for understanding where the economy is today, let alone to make educated estimates on the pace of the recovery. Traditional economic reports are released with varying lags, are often revised, and in this crisis sometimes contain significant caveats highlighting challenges in the data collection process. To cope with this challenge, economists are turning to what has become known as now-casting and using a variety of alternative data sources to get daily updates on what the economy is doing right now, as opposed to last month or last quarter. Specific alternative data sets are much more informative than broad-based economic reports in terms of answering critical behavioral questions about consumers and businesses.
In this research report, we will briefly summarize what the lagged economic data has told us about the economy and the rebound from the pandemic-induced shutdown. And then we will shift gears to answer four critical questions about changing behavioral patterns, specifically:
- Are consumers willing to gather indoors with large numbers of strangers?
- How fast are white-collar employees returning to their offices?
- Will business travel make a comeback in the short-term?
- What can now-casting tell us about the current pace of the economic recovery?
The monthly jobs data have told us that the economic recovery began in May 2020, when the economy brought back 2.7 million jobs after losing almost 21 million jobs in April. By July 2020, the U.S. economy was still almost 13 million jobs short of the February 2020 peak in employment just before the pandemic-induced shutdown.
The weekly new unemployment insurance claims data paints a somewhat more discouraging picture, with a million new individuals applying for unemployment insurance every week, even in June and July. Yes, the worst of the job losses were recorded in April, but layoffs were continuing through July even as many individuals went back to jobs from which they had been furloughed during the shutdown period. There are also some inconsistencies in the jobs data that are hard to reconcile. For example, the monthly jobs data as of July reported 16,338,000 people unemployed and yet there are 32,118,678 people claiming unemployment benefits from all the programs that are available. Sorting through the jobs data is no small research challenge.


GDP data is reported quarterly, so it is even more backward-looking than the jobs data. The peak level of real GDP was recorded in Q4 2019. The Q2 2020 real GDP level was 10.6% below the peak, with most of the damage coming in March and April 2020. Data revisions, however, are highly likely. Much of the economic data for the month of June was estimated by the Department of Commerce for the preliminary Q2 real GDP report, including June retail sales, exports, and imports. Moreover, the economy is now halfway into the third quarter, so the quarterly GDP data is, by nature, too lagged to help us understand where the economy is right now. So, let us move to the alternative data and see what we can learn.
The Federal Reserve (Fed) took an extremely cautious stance on the current state of the US economy in the press release it issued immediately after its Federal Open Market Committee (FOMC) meeting on July 29, 2020. The Fed said: “The path of the economy will depend significantly on the course of the virus.” This statement is quite obvious to anyone paying attention to the pandemic, but coming from the Fed, the statement underscores that the dynamic path of the virus and how consumers and businesses react to that path may be more important for the future course of economic activity than any policy measures the Fed or the federal government might undertake. Put another way, the Fed can provide significant support to the economy to cushion the damage, as they have done, but the course of the economic recovery depends in a very large way on the nature of the virus.
So, how were consumers adjusting and re-adjusting behavior as the virus peaked, declined, and later surged again? We turn to data about dining in restaurants as a proxy to help us determine whether people are willing to spend time indoors with significant numbers of strangers. Our data source is from Open Table®, a popular online reservation service for restaurants. Open Table® provides daily updates on how many people were seated for dining in restaurants the previous day. This includes indoor and outdoor dining, so the data is not perfect, but it is highly informative.
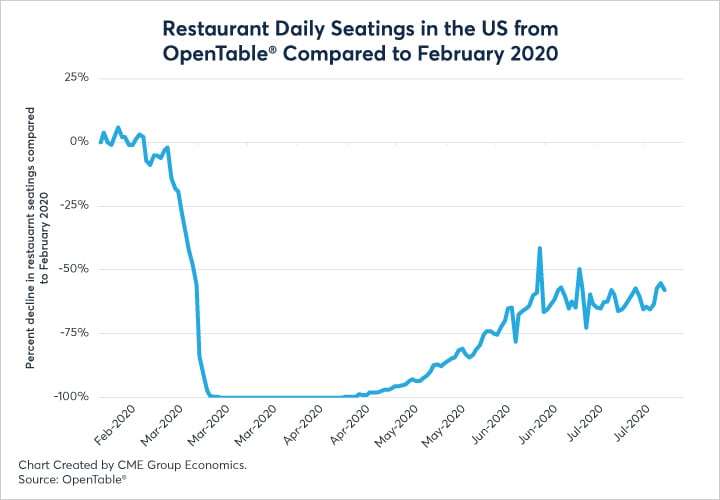
There was a near total shutdown of the restaurant industry in March and April as governments mandated most restaurants to close. The re-opening came in stages with different timetables in different states and cities. What is clear is that there was a willingness to return to restaurants in June, with daily seatings peaking at about 40% below the February 2020 rate June 21. After that though, the virus re-emerged in various parts of the country, and in July, individuals pulled back from dining in restaurants to a run-rate closer to 60% below the February rate.
Based on restaurant dining data, how willing are consumers are to go shopping, attend events and generally return to pre-pandemic indoor activities with large numbers of strangers? The answer is clear: US consumers are not halfway back in terms of their willingness to associate indoors with strangers, and the July pause after the May-June recovery signals that the reluctance to participate in indoor group activities may not be quickly or easily reversed. This data supports the narrative that the US recovery stalled in July. For now-casting, when this indicator turns more positive, it can change the narrative for the whole economy in terms of optimism about the recovery, so we are watching this indicator very closely for any signs of an upturn.
III. How fast are white-collar employees returning to their offices?
When office buildings closed, most white-collar workers had to work from home. In general, the abrupt shift to a work from home (WFH) culture went well. Many companies even reported an increase in productivity. WFH is now a well-established acronym. Some businesses are now delaying a return of their staff to their offices, not just for health concerns although that is primary, but also to figure out how to re-arrange office space to accommodate a permanent shift toward allowing more flexible work arrangements. This will mean that down the road, the company can save considerable money by reducing its real estate footprint.
So, how do we use alternative data to monitor the WFH phenomenon and the pace of sending white collar workers back to the desks in office towers? Our choice of alternative data to help answer this question is commuter rail traffic in big cities. Specifically, we take our proxy from New York City (NYC) and commuter rail traffic into the Manhattan business districts.

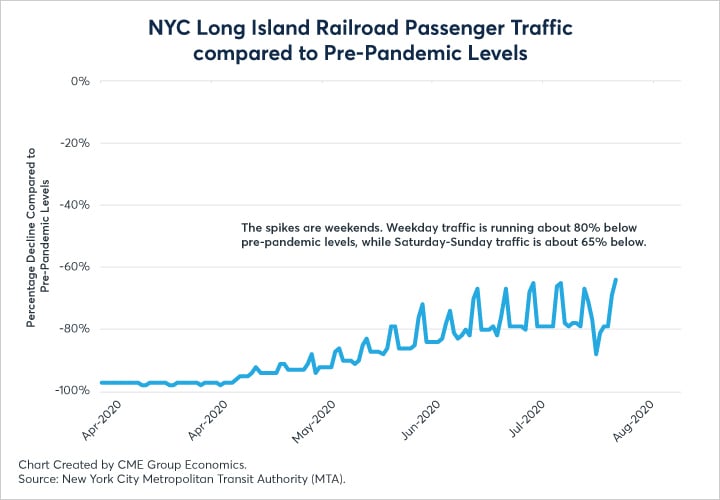
Passenger traffic on commuter rail lines from north of NYC (MetroNorth) and east of NYC (Long Island Railroad) are down sharply and do not appear to be recovering quickly. Weekday NYC commuter rail traffic is running about 80% below pre-pandemic levels. As WFH has becomes more entrenched, this could potentially signal a permanent change in behavior. Many companies may hope to save on office space, and many workers appreciate the added flexibility.
A possible shift toward more flexible work hours and a WFH culture has huge ramifications for the businesses that depended on a large, steady flow of people coming into office towers in the business districts of major cities. It stands to reason that restaurants would not see the same revenue from the proverbial business lunches as they did before the pandemic. Formerly busy streets would have less vehicle traffic and dramatically reduced foot traffic. This could be very tough news for retail stores in downtown business districts. Everyone from shoeshine stands and street food vendors to upscale high-end clothing and accessory stores could be impacted. In short, the trickle-down effects from a potential shift to a WFH culture could depress economic activity in a major way in downtown business districts.
IV. Will business travel make a comeback?
The shift to a WFH culture was made possible by the efficiency provided by virtual meeting software. Sure, there were more than a few bugs at first for many companies, but the virtual meeting providers worked through the challenges very quickly. The success of virtual meetings in getting the job done without a business trip has not been lost on companies as a future way to save money. Business travel will likely not go away, but it is possible that it will not return to its pre-pandemic level, either.

Our proxy to track business travel is provided by the US Transportation Security Administration (TSA), which provides data on the number of airline travelers passing through airport security checkpoints every day. This number includes travel for family reasons, tourism and business. Nevertheless, without business travel, the number of passengers going through security checkpoints seems unlikely to return to pre-pandemic levels.
The airline passenger data matches the restaurant data. There was a spring recovery, which stalled in late June as the virus surged again. At current levels of airline passengers, the U.S. is three-quarters below pre-pandemic levels. We can safely say that business travel has hardly even started its recovery, much less given us a good clue about how much business travel might recover later in 2020 or 2021. The airline passenger data supports the conclusion that the economic recovery, which started in May and was gaining momentum in June, stalled in July.
Here is a summary of our findings from our alternative data sources:
- Individuals remain cautious about going out to eat and, by extension, gathering in large groups indoors.
- WFH could be here to stay, at least for a significant portion of white-collar workers. The shift to more flexible work hours and a WFH culture means that many support services, retail stores, and restaurants in downtown business districts could face severe headwinds even as the pandemic wanes.
- Business travel has not started its comeback, and when it does, it may be sharply lower than pre-pandemic levels.
- White-collar businesses are assessing their real estate needs and travel requirements. Both of these items offer consider cost savings, suggesting that the WFH and reduced business travel patterns could be here to stay. Companies that depend on business travel, such as airlines, hotels and restaurants, could see a much slower recovery than the rest of the economy.
At this point, halfway through the third quarter of 2020, the weekly new unemployment insurance claims data suggest the labor market recovery is slowing. Some jobs are coming back, but others are still lost, which slows the net gains.
Q3 2020 real GDP appears likely to show a bounce, because we know from our alternative data that July levels were significantly above April, which was the bottom of this deep recession. The Federal Reserve Bank of Atlanta’s “GDP Now” web site has its estimate of real GDP showing that third quarter GDP might be 5% above the second quarter (actual, not annualized) and 6% below the fourth quarter 2019 peak level.
Unfortunately, given the tempering nature of our now-casting with alternative data as we sought to answer several key consumer and business behavioral questions, the bottom line is:
- Many of changes in the patterns of consumer and business activities could lead to an uneven and drawn-out economic recovery.
- The rebound stalled in July, although this still leaves the Q3 2020 real GDP data well above Q2 2020 and well below the Q4 2019 peak.
- We continue to monitor daily updates of restaurant seatings, airline passenger traffic and commuter rail traffic as key early indicators of behavioral shifts that could lead to a more positive and optimistic narrative for the U.S. economy as the virus comes under greater control.