Rate of Return (ROR)
ROR is the ratio of money gained on an investment relative to the amount of money invested. It is calculated using the compounding effect. With it the ROR for nmonths Rn is computed as:
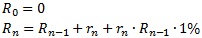
where Di are motnhly performance data (one value per month).
Last Month
Rate of return for the most current month as reported by the program manager.
3 Months ROR
Compounded rate of return for the last three months.
Year To Date
Current year’s return, calculated by summing the returns of current year months using the compounding effect.
12 Months ROR
Compounded rate of return for the last twelve months.
36 Months ROR
Compounded rate of return for the last thirty-six months.
Average ROR
Compounded average annual rate of return, which is calculated using the final VAMI.
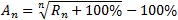
where R is the compounded return.
Total Return
Compounded rate of return since inception.
Value Added Monthly Index (VAMI)
This index reflects the growth of a hypothetical $1,000 in a given investment over time. The index is equal to $1,000 at inception. Subsequent month-end values are calculated by multiplying the previous month’s VAMI index by 1 plus the current month rate of return.
Standard deviation
Standard deviation measures the degree of variation/uncertainty of returns around the mean/average return. The higher the volatility of the investment returns, the higher the standard deviation. That is why the standard deviation is often used as a measure of risk.
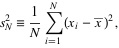
where s2 also denoted as ?2 is variance, xis are values and x is mean of values.
The square root of the variance ? is the standard deviation.
Down.Deviation
Similar to Standard Deviation, but Downside Deviation only takes losing/negative periods into account. That´s why it does not penalize the program for higher then average return, but only for higher then average loss.
Sharpe Ratio
The Sharpe Ratio is a measure of the risk-adjusted return of an investment.

where r is the average monthly return, rr f is the risk-free return (we use 0% per year as a risk-free return) and ? is the standard deviation of the monthly returns over the same period.
This gives you s, the monthly Sharpe you can annualize by multiplying it by the square root of 12.
Sortino Ratio
Return/risk ratio. The concept and formula as in Sharpe ratio. The only difference is that it is calculated using standard deviation of negative returns only as ?(returns below a minimum acceptable threshold).
Sterling Ratio
Return/risk ratio. Return is defined as the compound annualized rate of return over the last 3 years. Risk is defined as the average yearly maximum drawdown over the last 3 years less an arbitrary 10%.
Calmar Ratio
Return/risk ratio. Return is defined as the compound annualized rate of return over the last 3 years, risk as the maximum drawdown over the last 3 years.
Skewness
Skewness characterizes the degree of asymmetry of a distribution of returns around its mean. Positive skewness indicates a distribution with an asymmetric tail extending toward more positive values. Negative skewness indicates a distribution with an asymmetric tail extending toward more negative values.
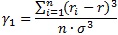
where ri is the return of the i-th month, r is the average monthly return, n denotes the number of months and ? is the standard deviation of the monthly returns.
Kurtosis
Kurtosis characterizes the relative peakedness or flatness of a distribution compared with the normal distribution. Positive kurtosis indicates relatively peaked distribution. Negative kurtosis indicates relatively flat distribution.
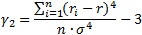
where ri is the return of the i-th month, r is the average monthly return, n denotes the number of months and ? is the standard deviation of the monthly returns.
Drawdown
A drawdown is any losing period during an investment. It is defined as the percent retrenchment from an equity peak to an equity valley. A drawdown starts with the beginning of an equity retrenchment and continuous until a new equity high is reached. (a drawdown encompasses both the period from the equity peak to the equity valley (length) and the time from the equity valley to the new equity high (recovery)). Maximum Drawdown is then the greatest cumulative percentage decline in equity.
Beta
Beta is the slope of the regression line. Beta measures the risk of a particular investment relative to the market as a whole (the “market” can be any index or investment you specify). It describes the sensitivity of the investment to broad market movements. For example, in equities, the stock market (the independent variable) is assigned a beta of 1.0. An investment which has a beta of 0.5 will tend to participate in broad market moves, but only half as much as the market as a whole.
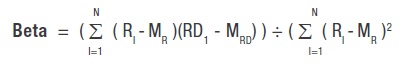
Where:
RI = The return of the independent variable for period I,
RDI = The return of the dependent variable for period I,
MR = The mean return of the independent variable,
MRD = The mean return of the dependent variable and
N = Number of Periods
Correlation and Correlation Coefficient
The correlation coefficient is a statistical measure of the degree of linear relationship between two variables. The correlation coefficient may take on any value between plus and minus one. The sign of the correlation coefficient (+ , -) defines the direction of the relationship, either positive or negative. A positive correlation coefficient means that as the value of one variable increases, the value of the other variable increases as well; as one decreases the other decreases too. Taking the absolute value of the correlation coefficient measures the strength of the relationship. Thus a correlation coefficient of zero indicates the absence of a linear relationship and correlation coefficients of one and minus one indicate a perfect linear relationship.
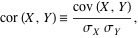
where ?X denotes standard deviation of the first variable, ?Y standard deviation of the second variable and
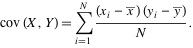
where x and y are means of first and second variable.
Stress testing
Stress testing is a method of determining how the program will behave during a period of financial crisis. We use the worst monthly S&P500 returns as a stress time. You can also use hypothetical scenarios (for example Monte Carlo simulation) or known historical events (for example Russian debt default in 1998 or 9/11 terrorist attacks).
Value at Risk
This is the maximum amount of capital that the position can expect to lose within a specified holding period (we use 1 month period) and with a specified confidence level (we use 95%). Example: if VaR is -10%, you can expect that 95% of the next month returns will be better than -10%.
Correl.S&P 500
Correlation vs. S&P 500.
Correl.DJ/CS MF
Correlation vs. Dow Jones Credit Suisse Managed Futures Index.
Correl.NewEdge
Correlation vs. NewEdge CTA Index.
Positive months
Percentage of positive months.
Avg pos.month
Average positive month in percentage.
Avg losing month
Average losing/negative month in percentage.
Tracking Error
The difference between a portfolio’s returns and the benchmark.
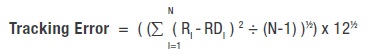
Where:
RI = The return of the independent variable for period I,
RDI = The return of the dependent variable for period and
N = Number of Periods.
Coefficient of determination (R2)
Measures how well the regression line fits the data. A high R2 value means that the regression line closely fits the data.
Treynor Ratio
This measure uses beta as the volatility measure rather than standard deviation.
Treynor Ratio = ( MR – RRF )
Where:
MR = Annualized Return of Investment and
RRF = Annualized Risk Free Return.
Jensen Alpha
Calculates the extent to which a fund has added value relative to a benchmark.
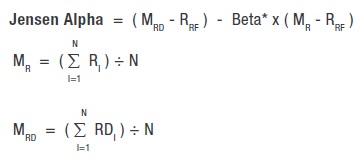
Where:
RI = Benchmark Return for period I,
RDI = Return for period I,
MR = Mean of return set R (Benchmark),
MRD = Mean of return set RD,
N = Number of Periods and
RRF = Period Risk Free Return.
Gain Deviation
Calculates the fund’s average return only for the periods with a gain and measures the variation of only the winning periods around this gain mean.
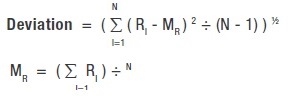
Where:
N = Number of Periods,
RI = Return for period I,
MG = Gain Mean,
GI = RI ( IF RI 3 0 ) or 0 ( IF RI < 0 ),
GGI = RI – M G ( IF RI 3 0 ) or 0 ( IF RI < 0 ) and
N G = Number of periods that RI 3 0.
Loss Deviation
Calculates the fund’s average return only for the periods with a loss and measures the variation of only the losing periods around this loss mean.
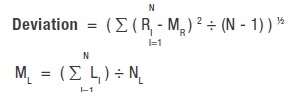
Where:
N = Number of Periods,
RI = Return for period I,
ML = Loss Mean,
LI = RI ( IF RI < 0 ) or 0 ( IF RI >= 0 ),
LLI = RI – ML ( IF RI < 0 ) or 0 ( IF RI >= 0 ) and
NL = Number of periods that RI < 0.
Alpha
Calculates the fund’s value added relative to a benchmark.
Alpha = MRD – Beta* x MR
Where:
MR = The mean return of the independent variable and
MRD = The mean return of the dependent variable.
Mar Ratio
A measurement of returns adjusted for risk that can be used to compare the performance of commodity trading advisors, hedge funds and trading strategies.
The MAR Ratio is calculated by dividing the compound annual growth rate of a fund or strategy since inception by its biggest drawdown.
*The higher the ratio, the better the risk-adjusted returns.
Ulcer Performance
Measures how well a fund or portfolio outperformed a money market index over a 12 month period compared with its associated downside risk.
Active Premium
The simplest benchmark ratio. It takes the fund’s annualized return and subtracts the benchmark’s annualized return to yield the fund’s gain or loss that is over or under the benchmark.
Active Premium = Investment’s annualized return – Benchmark’s annualized return
Information Ratio
Compares the fund’s active premium with the fund’s tracking error.
Information Ratio = Active Premium / Tracking Error