

By Tero Pesonen, Director, Private Equity and Private Credit, LocalTapiola Asset Management: Throughout its history, private credit as an asset class has operated primarily in the closed-end fund universe. As a result, performance comparisons have generally relied on the internal rate of return (IRR). Under this approach, funds that began investing in a given year are compared with one another based on their IRRs. However, numerous service providers have published private credit indices that allow investors to compare the asset class with relevant public-market benchmarks, particularly the high-yield bond market and the syndicated bank loan market.
The three most commonly used indices in the market come from Cliffwater (Cliffwater Direct Lending Index, or CDLI), Preqin, and Cambridge Associates. Cliffwater’s index focuses exclusively on direct lending, as its name suggests, while the other two providers offer several indices covering different sub-asset classes. This article examines Preqin’s broad, general-purpose index: the Preqin Private Debt Index.
Private Credit vs. Public Markets
Almost everyone active in the private credit market has encountered the chart below at some point. It is intended to demonstrate the excess returns that private credit offers relative to comparable risks in public markets. This excess return is commonly referred to as the illiquidity premium.
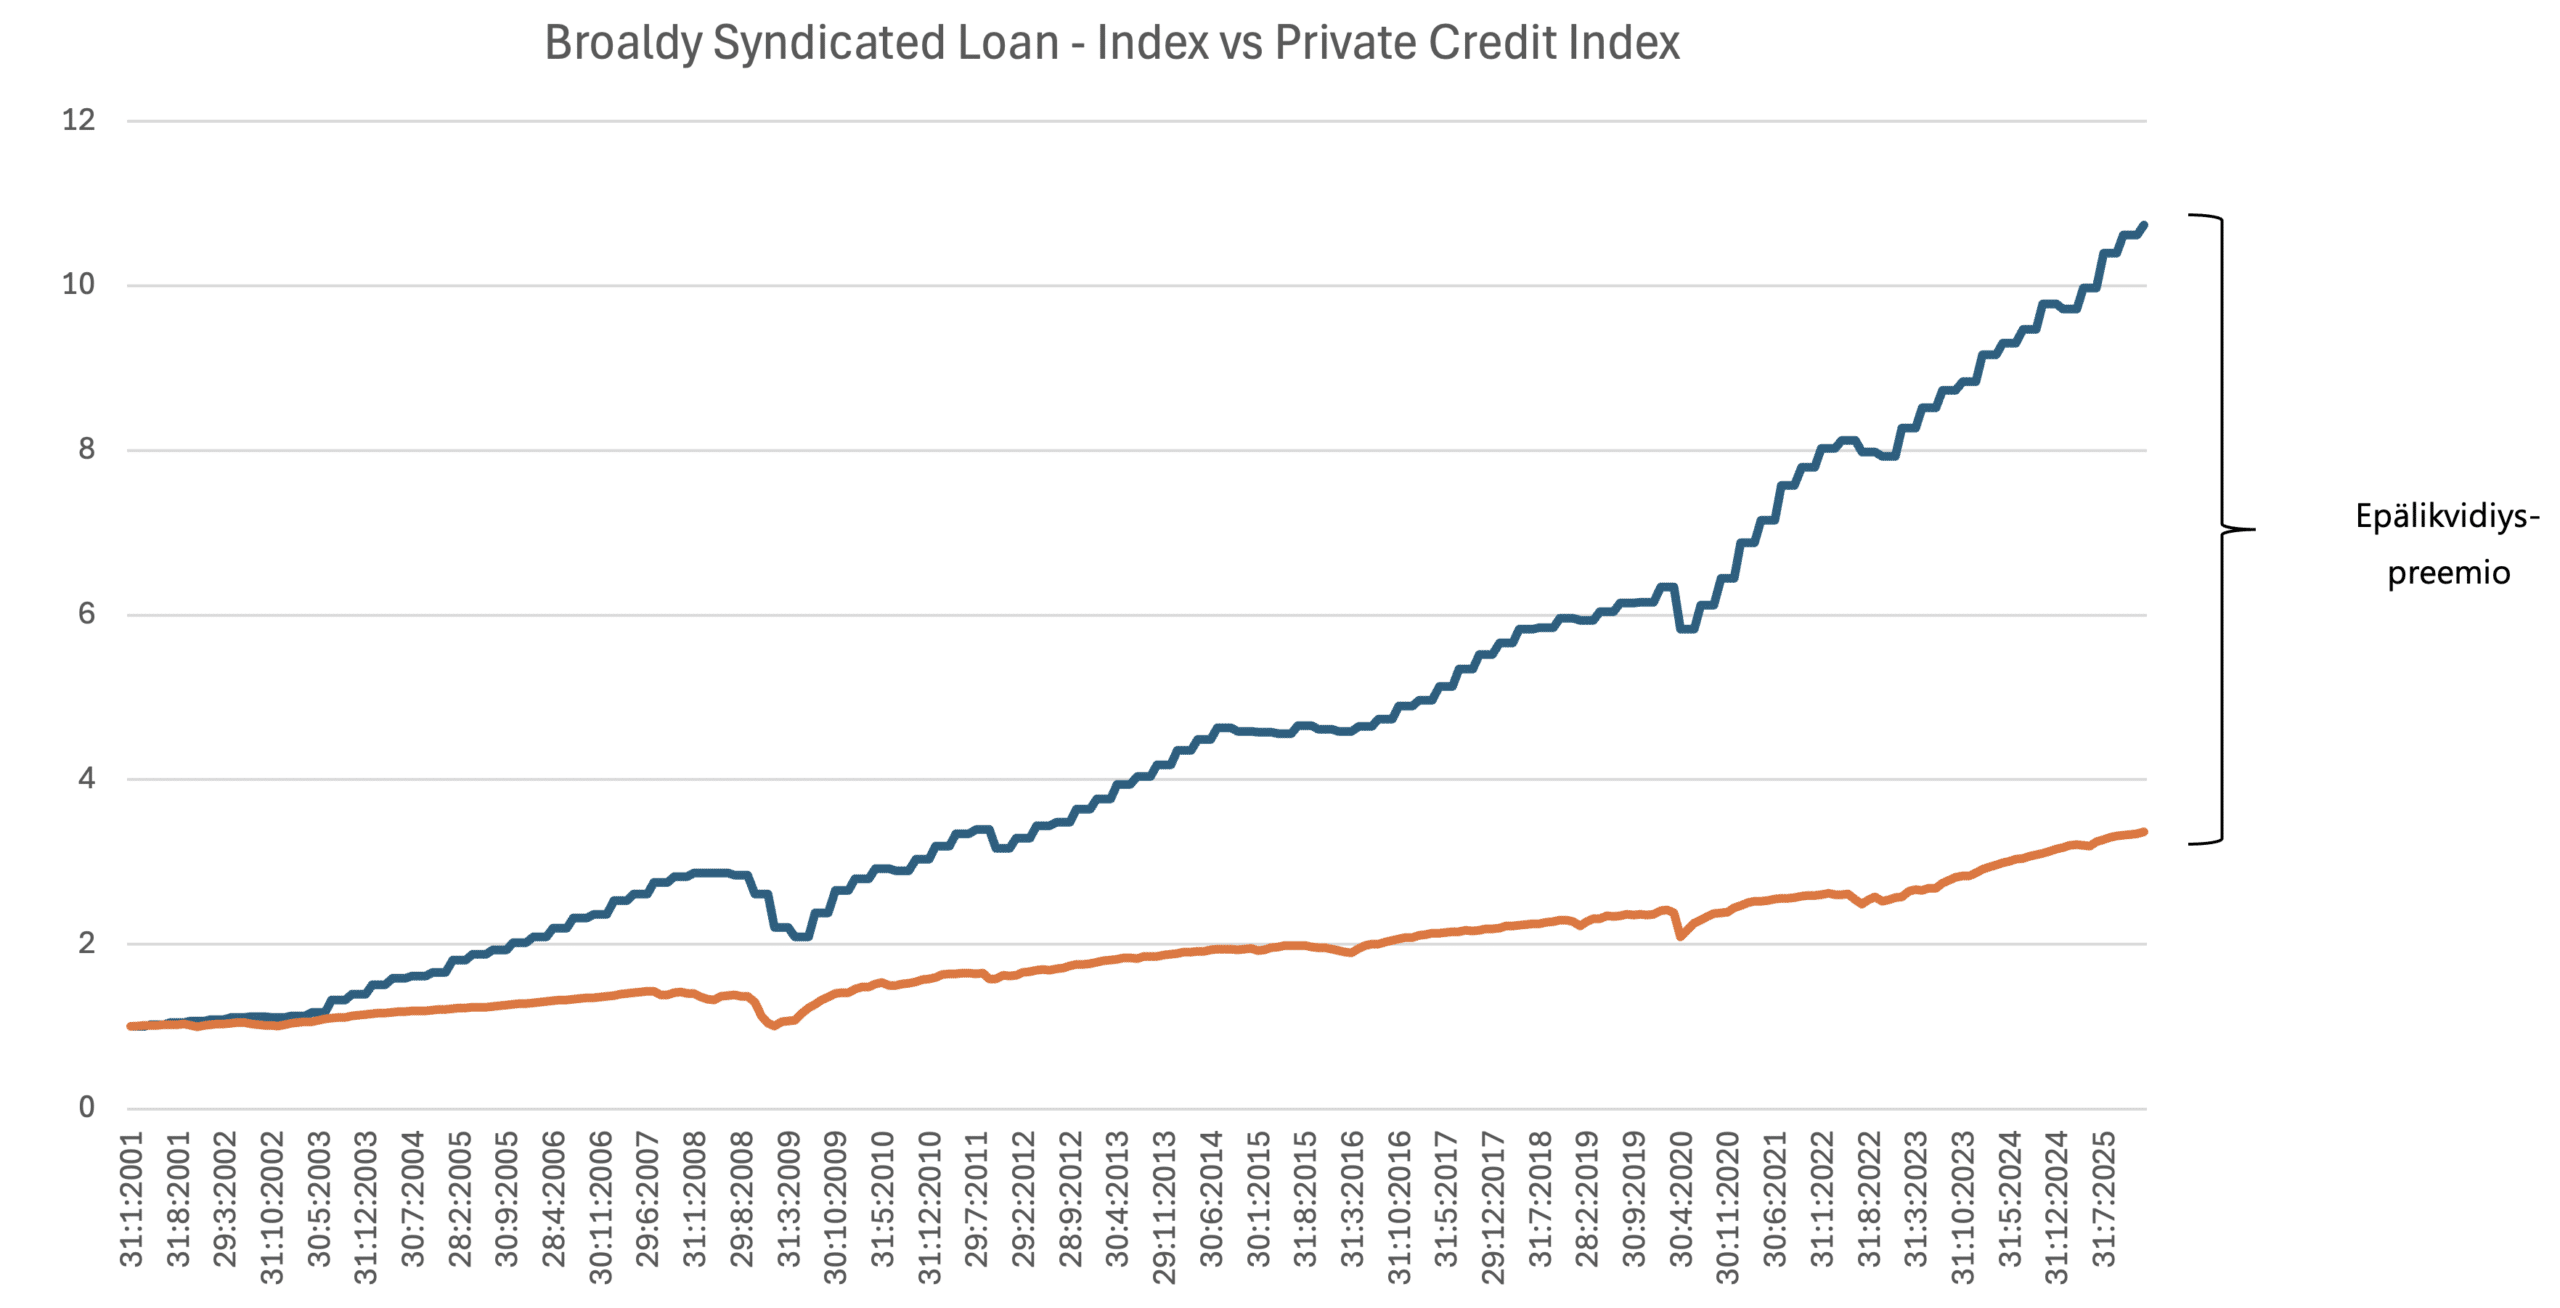
The chart above compares Preqin’s broad private credit index with a US syndicated bank loan index. Over a 25-year period, private credit has delivered an annualized return of approximately 10 percent, compared with around 5 percent for the syndicated bank loan market. At first glance, this suggests that the illiquidity premium has been both substantial and persistent.
The picture would indeed be attractive and straightforward if the chart compared like with like. Unfortunately, it does not. The syndicated bank loan index shows the performance of a broadly diversified portfolio of bank loans. The underlying loans consist exclusively of syndicated bank loans, representing a relatively homogeneous collection of senior-risk exposures, primarily to private equity-owned companies. The index does not employ leverage. Preqin’s Private Debt Index, by contrast, encompasses a much broader range of risks, from distressed strategies to direct lending. A substantial proportion of its direct lending exposure is also leveraged.
Consequently, presenting the chart above without explaining these differences suggests a relatively commercial approach to the comparison, unless the relevant caveats are disclosed at the point of sale.
The Strategy Composition of the Private Credit Index
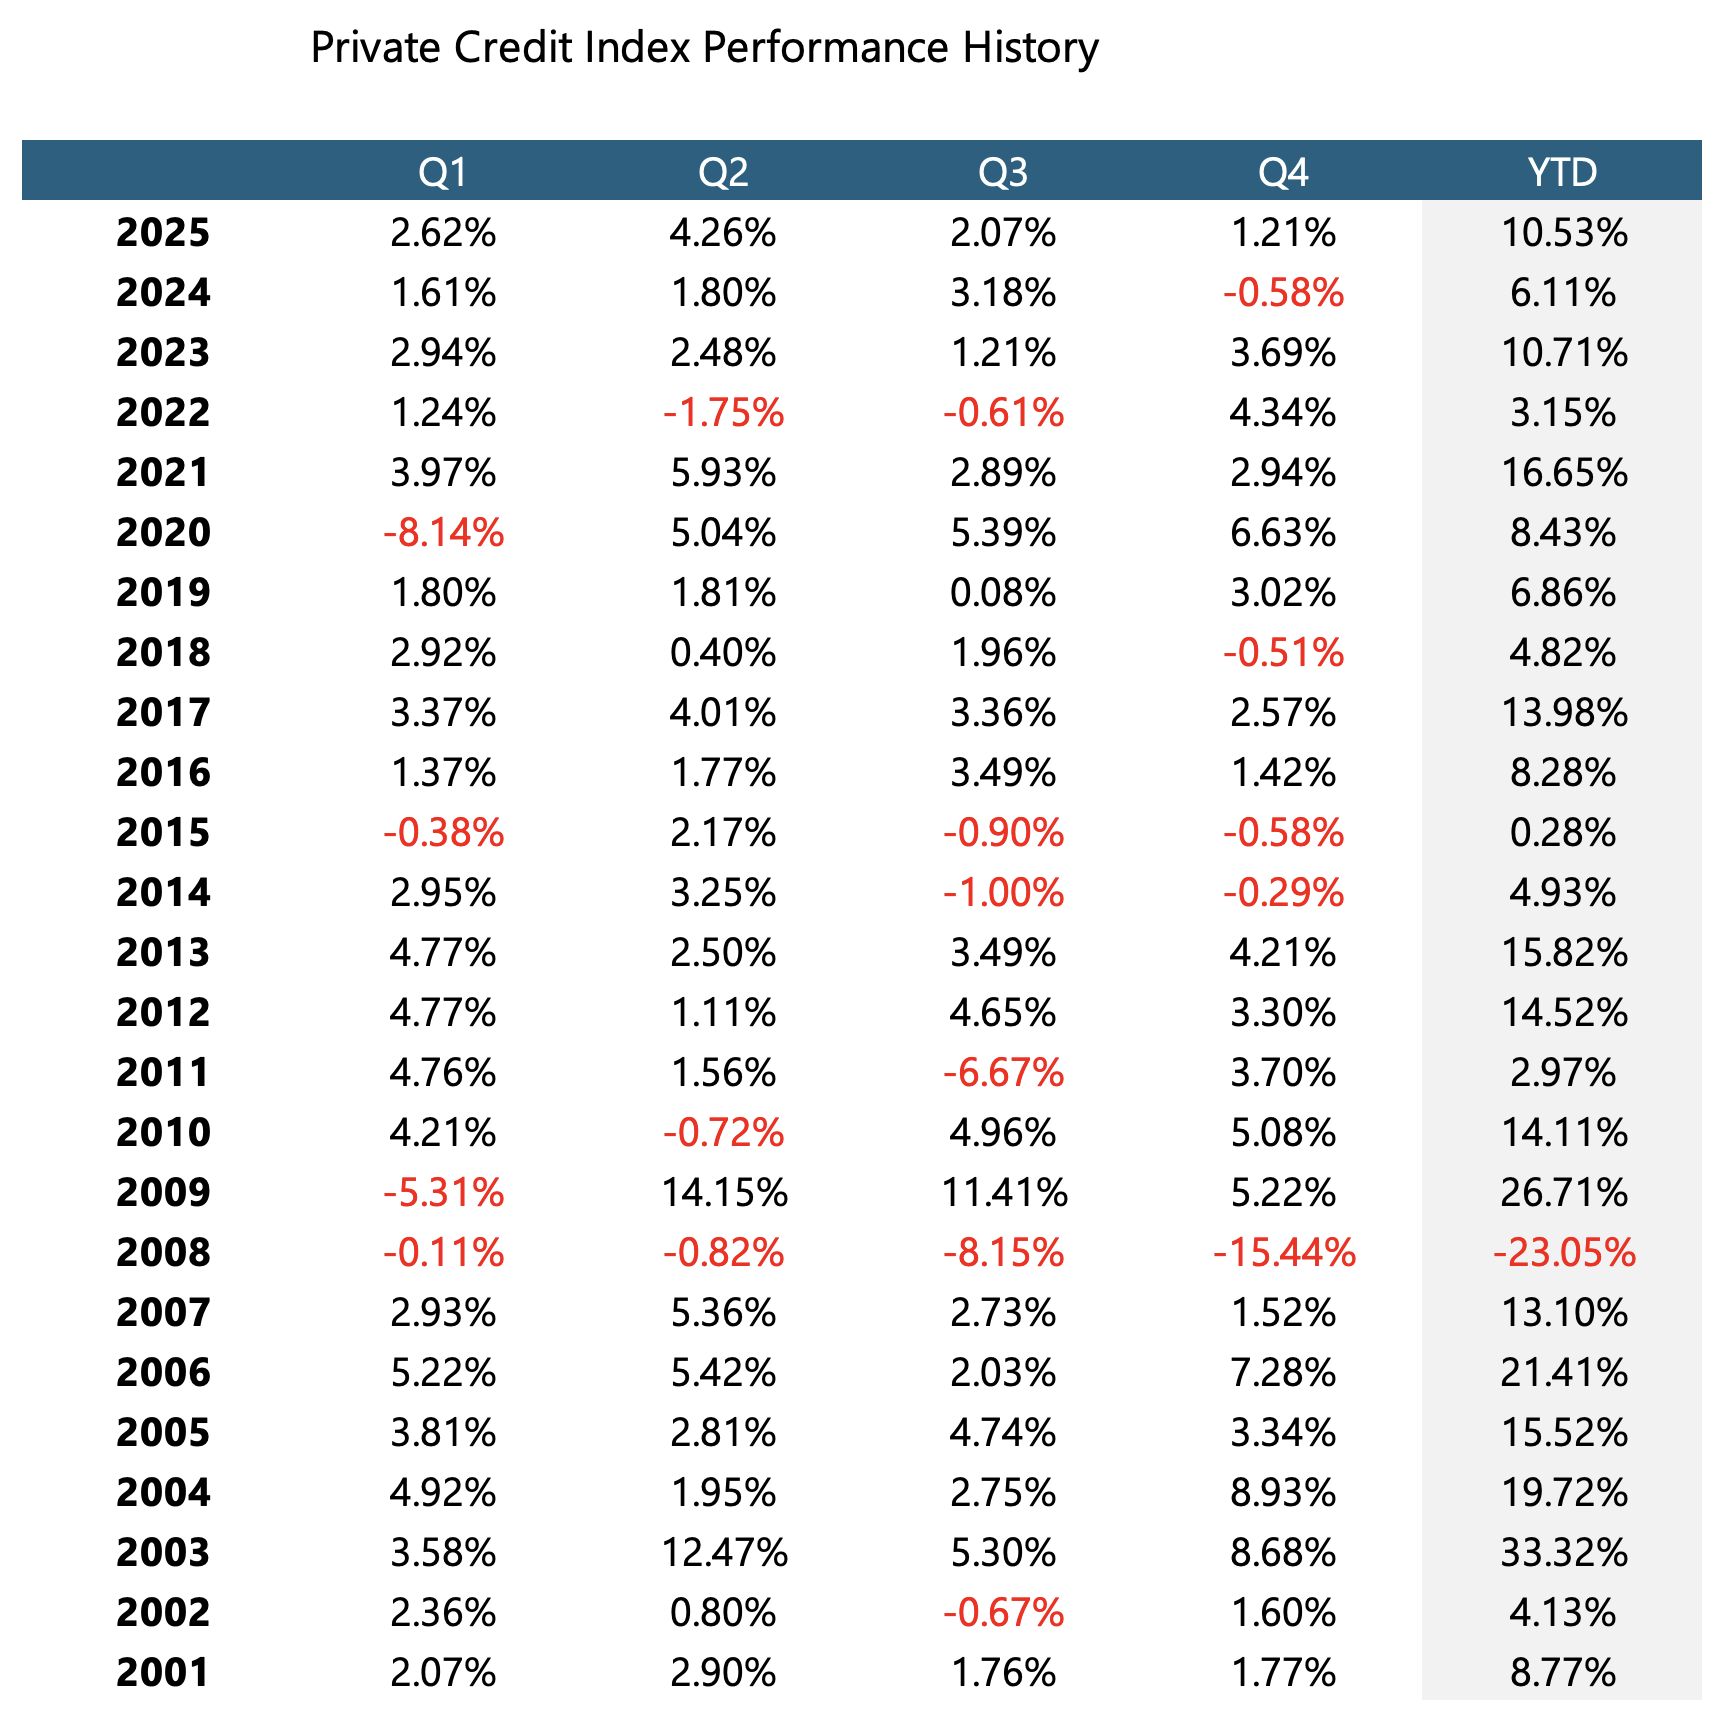
When people refer to private credit as an asset class, they unfortunately still often mean just one sub-asset class: direct lending. When investors see the chart above and hear that the asset class has delivered annualized returns of 10 percent over the long term, it is easy for the terminology and expectations surrounding returns to become blurred. Below is the return history of the Preqin Private Debt Index since its inception.
Although private markets are often criticized for the discretionary nature of their valuations, the index has experienced negative quarters as well. Of course, when an asset class relies on mark-to-model rather than mark-to-market valuations, its return volatility will differ from that of public markets.
On the other hand, one could argue that private-market valuations are more closely tied to underlying fundamentals because the influence of public-market sentiment and irrational investor behavior is removed from the equation. This argument holds, however, only when valuations are based on genuine assessments rather than commercial interests.
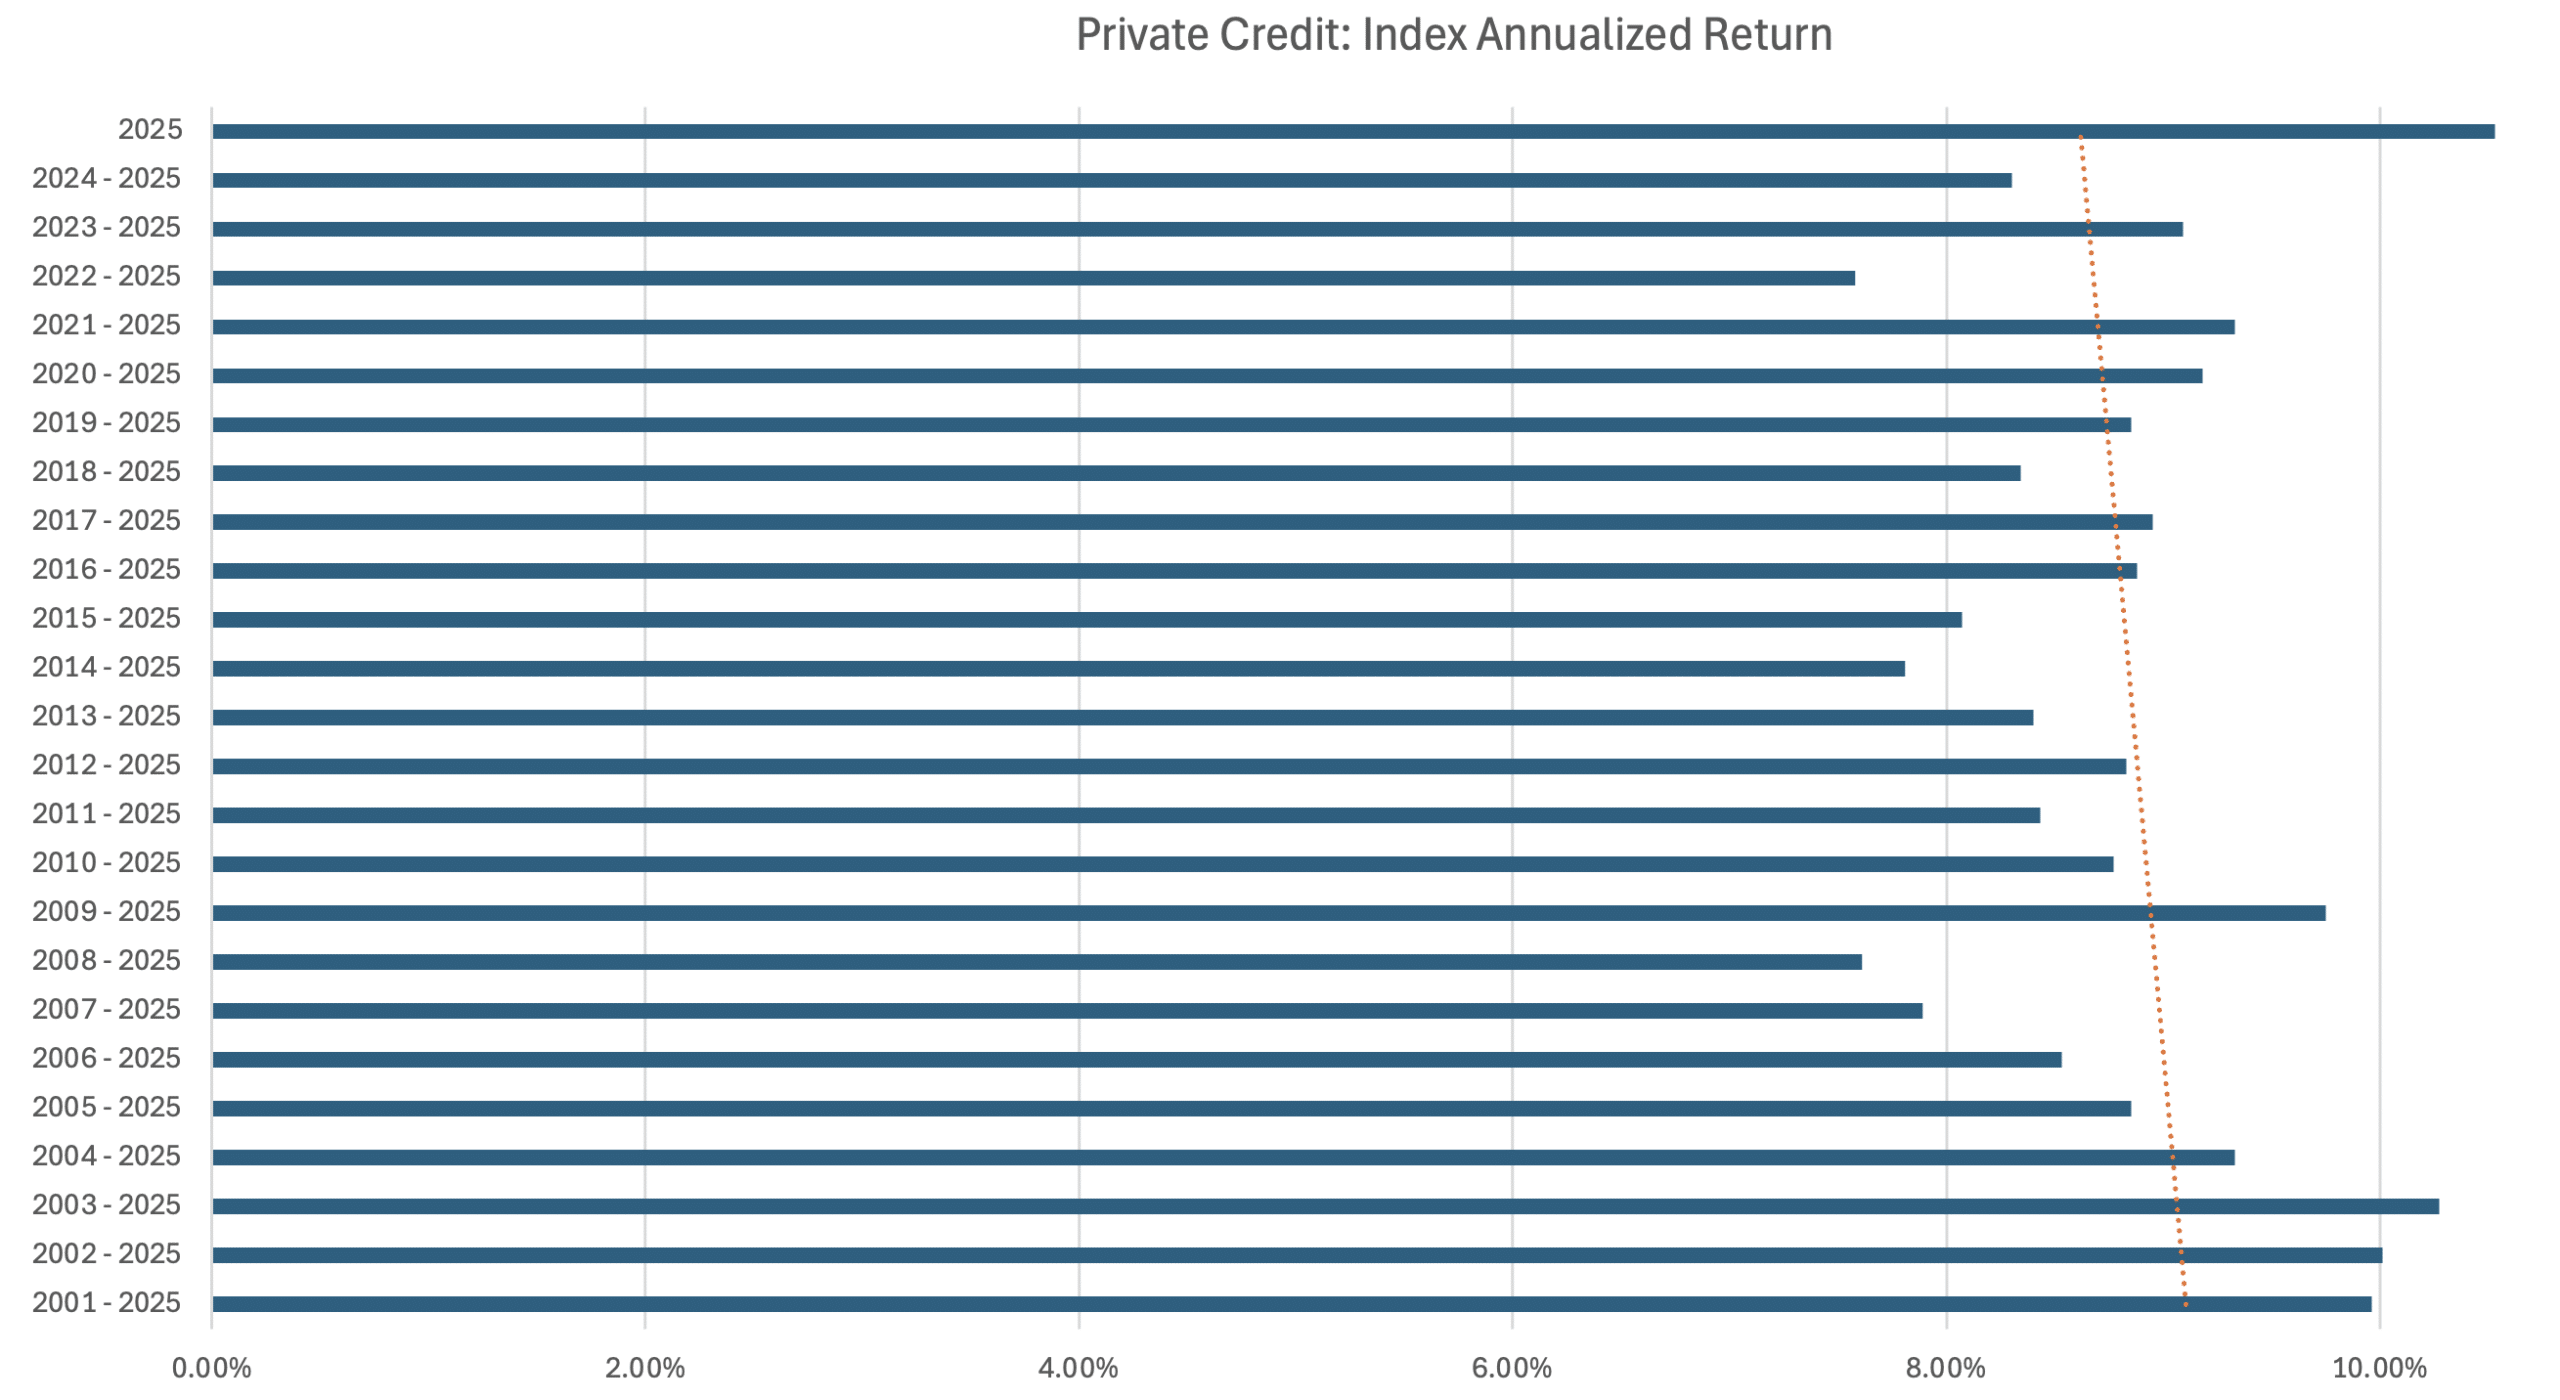
The next chart derives annualized index returns from different starting years using the annual returns shown in the accompanying table. The trend line indicates that returns have declined slightly as the measurement period moves closer to the present. During the seven years before the global financial crisis, from 2001 to 2007, the index delivered an annualized return of 16.2 percent. After the financial crisis subsided, the annualized return from 2011 onwards was 8.4 percent, while the return over the most recent four years was 7.6 percent.
This may seem surprising, particularly given that reference interest rates have been considerably higher over the past three years than they were during much of the 2010s. It is worth remembering, however, that private credit pricing is typically based on a reference rate plus a spread.
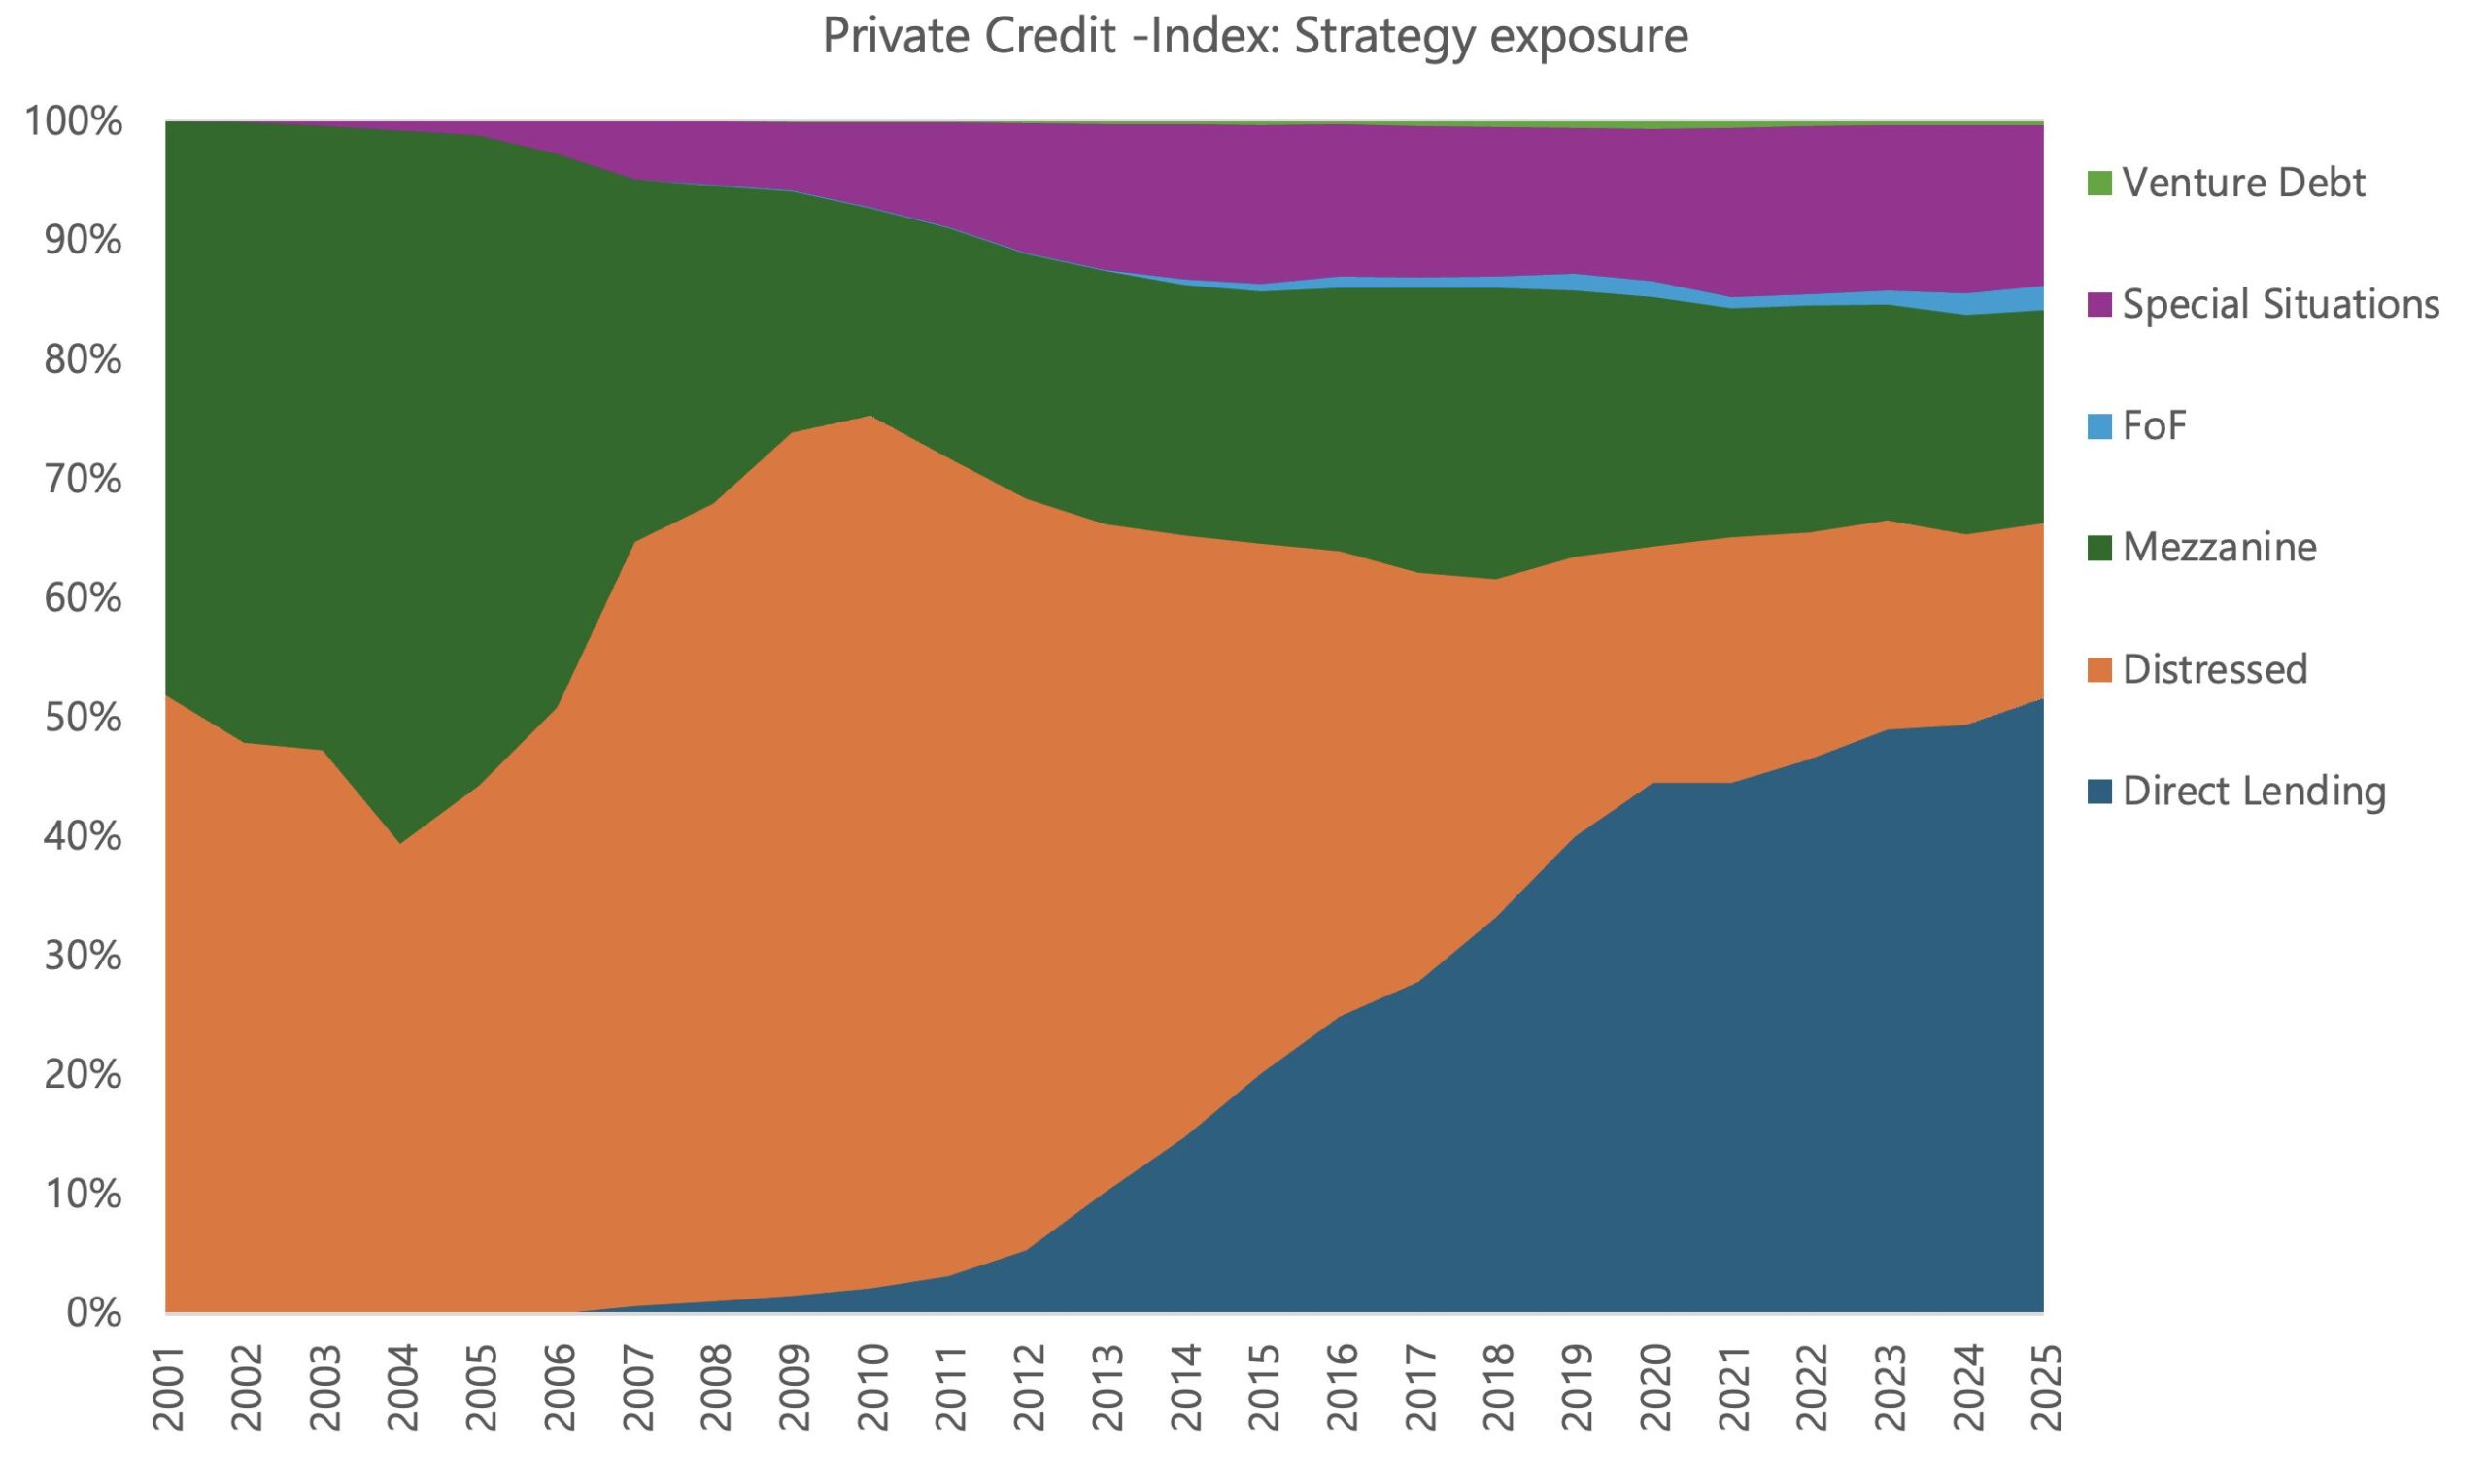
The explanation can be found, in part, in the index’s allocation across underlying strategies. A broad private credit index is by no means a straightforward representation of the average direct lending fund’s returns over time. Its performance reflects a wide range of strategies, and the composition has changed considerably over the years. The chart below shows the strategy composition of the Preqin Private Debt Index throughout its 25-year history.
In its early years, the index consisted exclusively of two sub-strategies: distressed debt and mezzanine. The reason is straightforward. Private credit had not yet emerged as a distinct asset class, the market was relatively small, and the universe of funds consisted entirely of these two strategies. Special situations gradually developed alongside the market and has accounted for approximately 10-15 percent of the index in recent years.
The most significant structural change, however, has been the substantial increase in direct lending’s weight. The sub-asset class expanded following the global financial crisis and the tightening of banking regulation, growing from zero to around 50 percent of the Preqin Private Debt Index in just over 15 years.
The four main strategies differ significantly in their risk profiles, at least on the surface, and therefore naturally in their expected returns, since risk and return go hand in hand. Their realized returns also differ. If the four strategies are ranked along a risk-return spectrum, distressed debt occupies the highest position, followed by mezzanine and special situations, which are relatively similar, with direct lending coming last.
It is therefore only natural that the index’s overall return declines as direct lending accounts for a larger share of its composition. The comparison between 2001–2007 and 2011–2025 illustrates this change in composition. During 2001–2007, distressed debt contributed 8.2 percentage points to the index’s annualized return of 16.2 percent, while mezzanine contributed 8.0 percentage points. During 2011–2025, direct lending contributed 2.6 percentage points to the annualized return of 8.4 percent. Distressed debt contributed 2.9 percentage points, mezzanine 1.8 percentage points, and special situations 1.1 percentage points.
Notably, distressed debt has remained the single largest contributor to returns over the past 15 years. Leveraged direct lending also plays a role in this picture. Particularly in the United States, it performed well in a zero-interest-rate environment and delivered returns approaching those of opportunistic strategies. More on this later.
Vintages and the Index
Since the private credit market still consists primarily of closed-end funds operating through capital calls and distributions, index construction has a particularly interesting characteristic. When examining a private credit index’s return for a particular year, it is important to understand what lies behind the headline figure beyond the strategy weights.
The net asset value (NAV) underlying each annual return consists of funds raised and invested over the course of the index’s history, rather than exclusively of investments made or funds raised during that particular year. The table below shows the percentage contribution of return data from funds raised in different years to the calculation of each year’s index return.
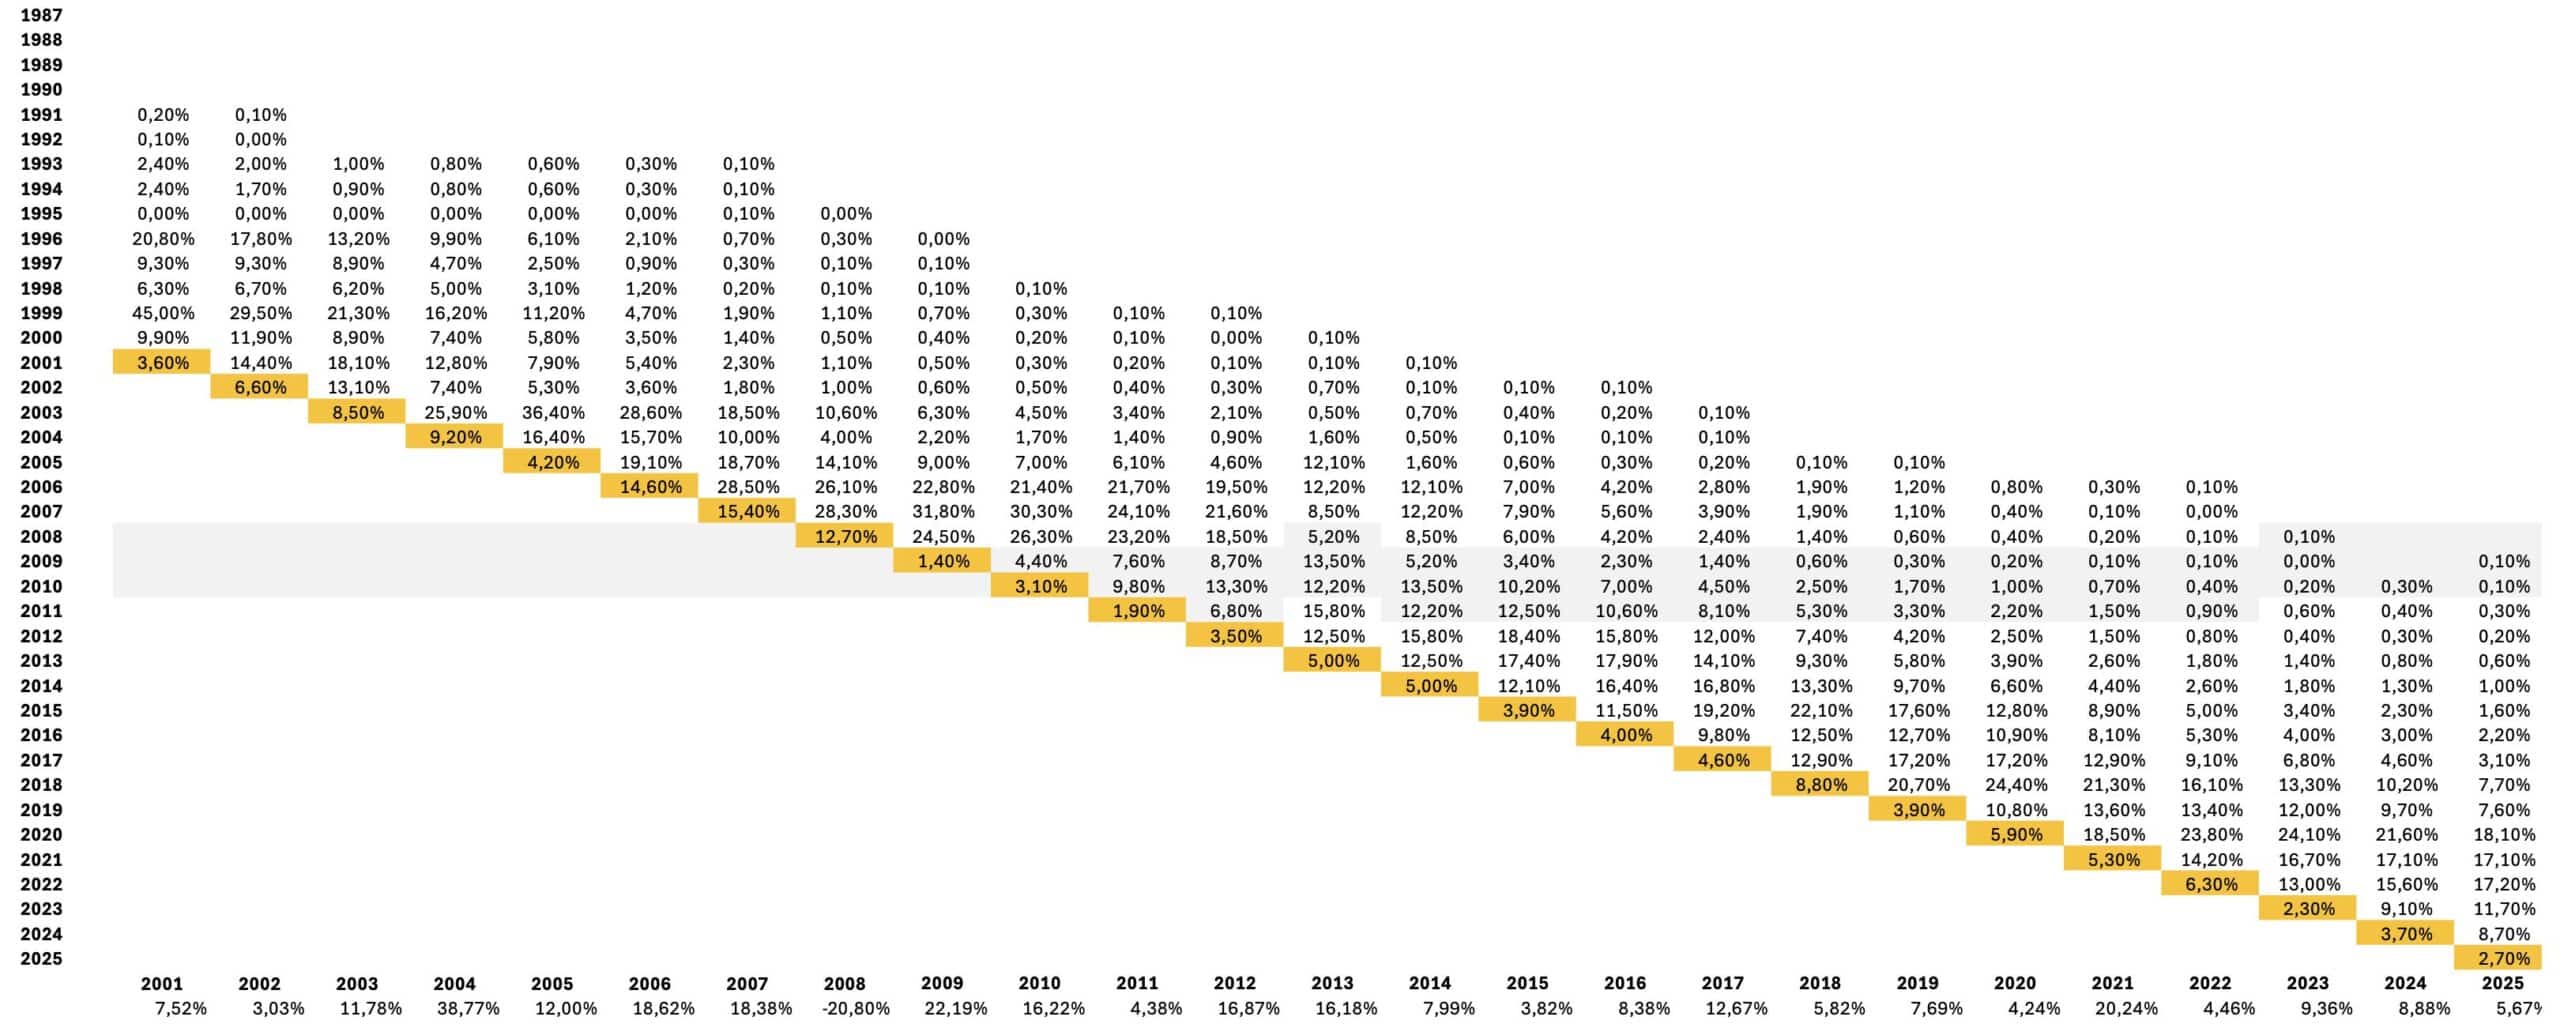
In simple terms, each year’s index return includes funds that began investing in that year, together with contributions from funds that began investing in earlier years, extending back an average of 14 years. For example, the index return for 2020 includes a small contribution from funds that began investing in 2006.
This composition has also changed over time. For annual returns from 2001 to 2005, funds from the year under review and the preceding three years accounted for 59 percent of the index, the following six years accounted for 41 percent, and the remaining older vintages contributed 1 percent. More recently, during 2021–2025, the year under review and the preceding three years accounted for only 52 percent, the following six years for 45 percent, and older vintages for 3 percent. Thus, the contribution of increasingly older vintages to each year’s index return has grown over time.
This matters when interpreting index returns because the timing of investments has a significant impact on a fund’s and ultimately its investments’ final performance. For example, funds that invested at the height of the global financial crisis and immediately afterwards, during the 2008–2010 vintages, have performed exceptionally well. As long as these funds remain represented in the index, they continue to contribute positively to its returns, even though the underlying investments were made a long time ago.
Geography and the Index
It is hardly news that the Preqin Private Debt Index has a substantial North American weighting. Participants in the leveraged finance markets – including high-yield bonds, syndicated bank loans, and private credit – know that the market is divided approximately 75 percent North America and 25 percent Europe across these segments.
The chart illustrates the geographical composition of the Preqin Private Debt Index over time. Europe’s share increased in the 2010s, mainly via growth in direct lending.
Geographical weights reflect differences in market size and activity. This is important to understand, particularly when considering currency exposure. For private credit investors, however, geographical allocation has an additional significance. Its importance has grown in recent years as direct lending has taken a substantial share of the index.
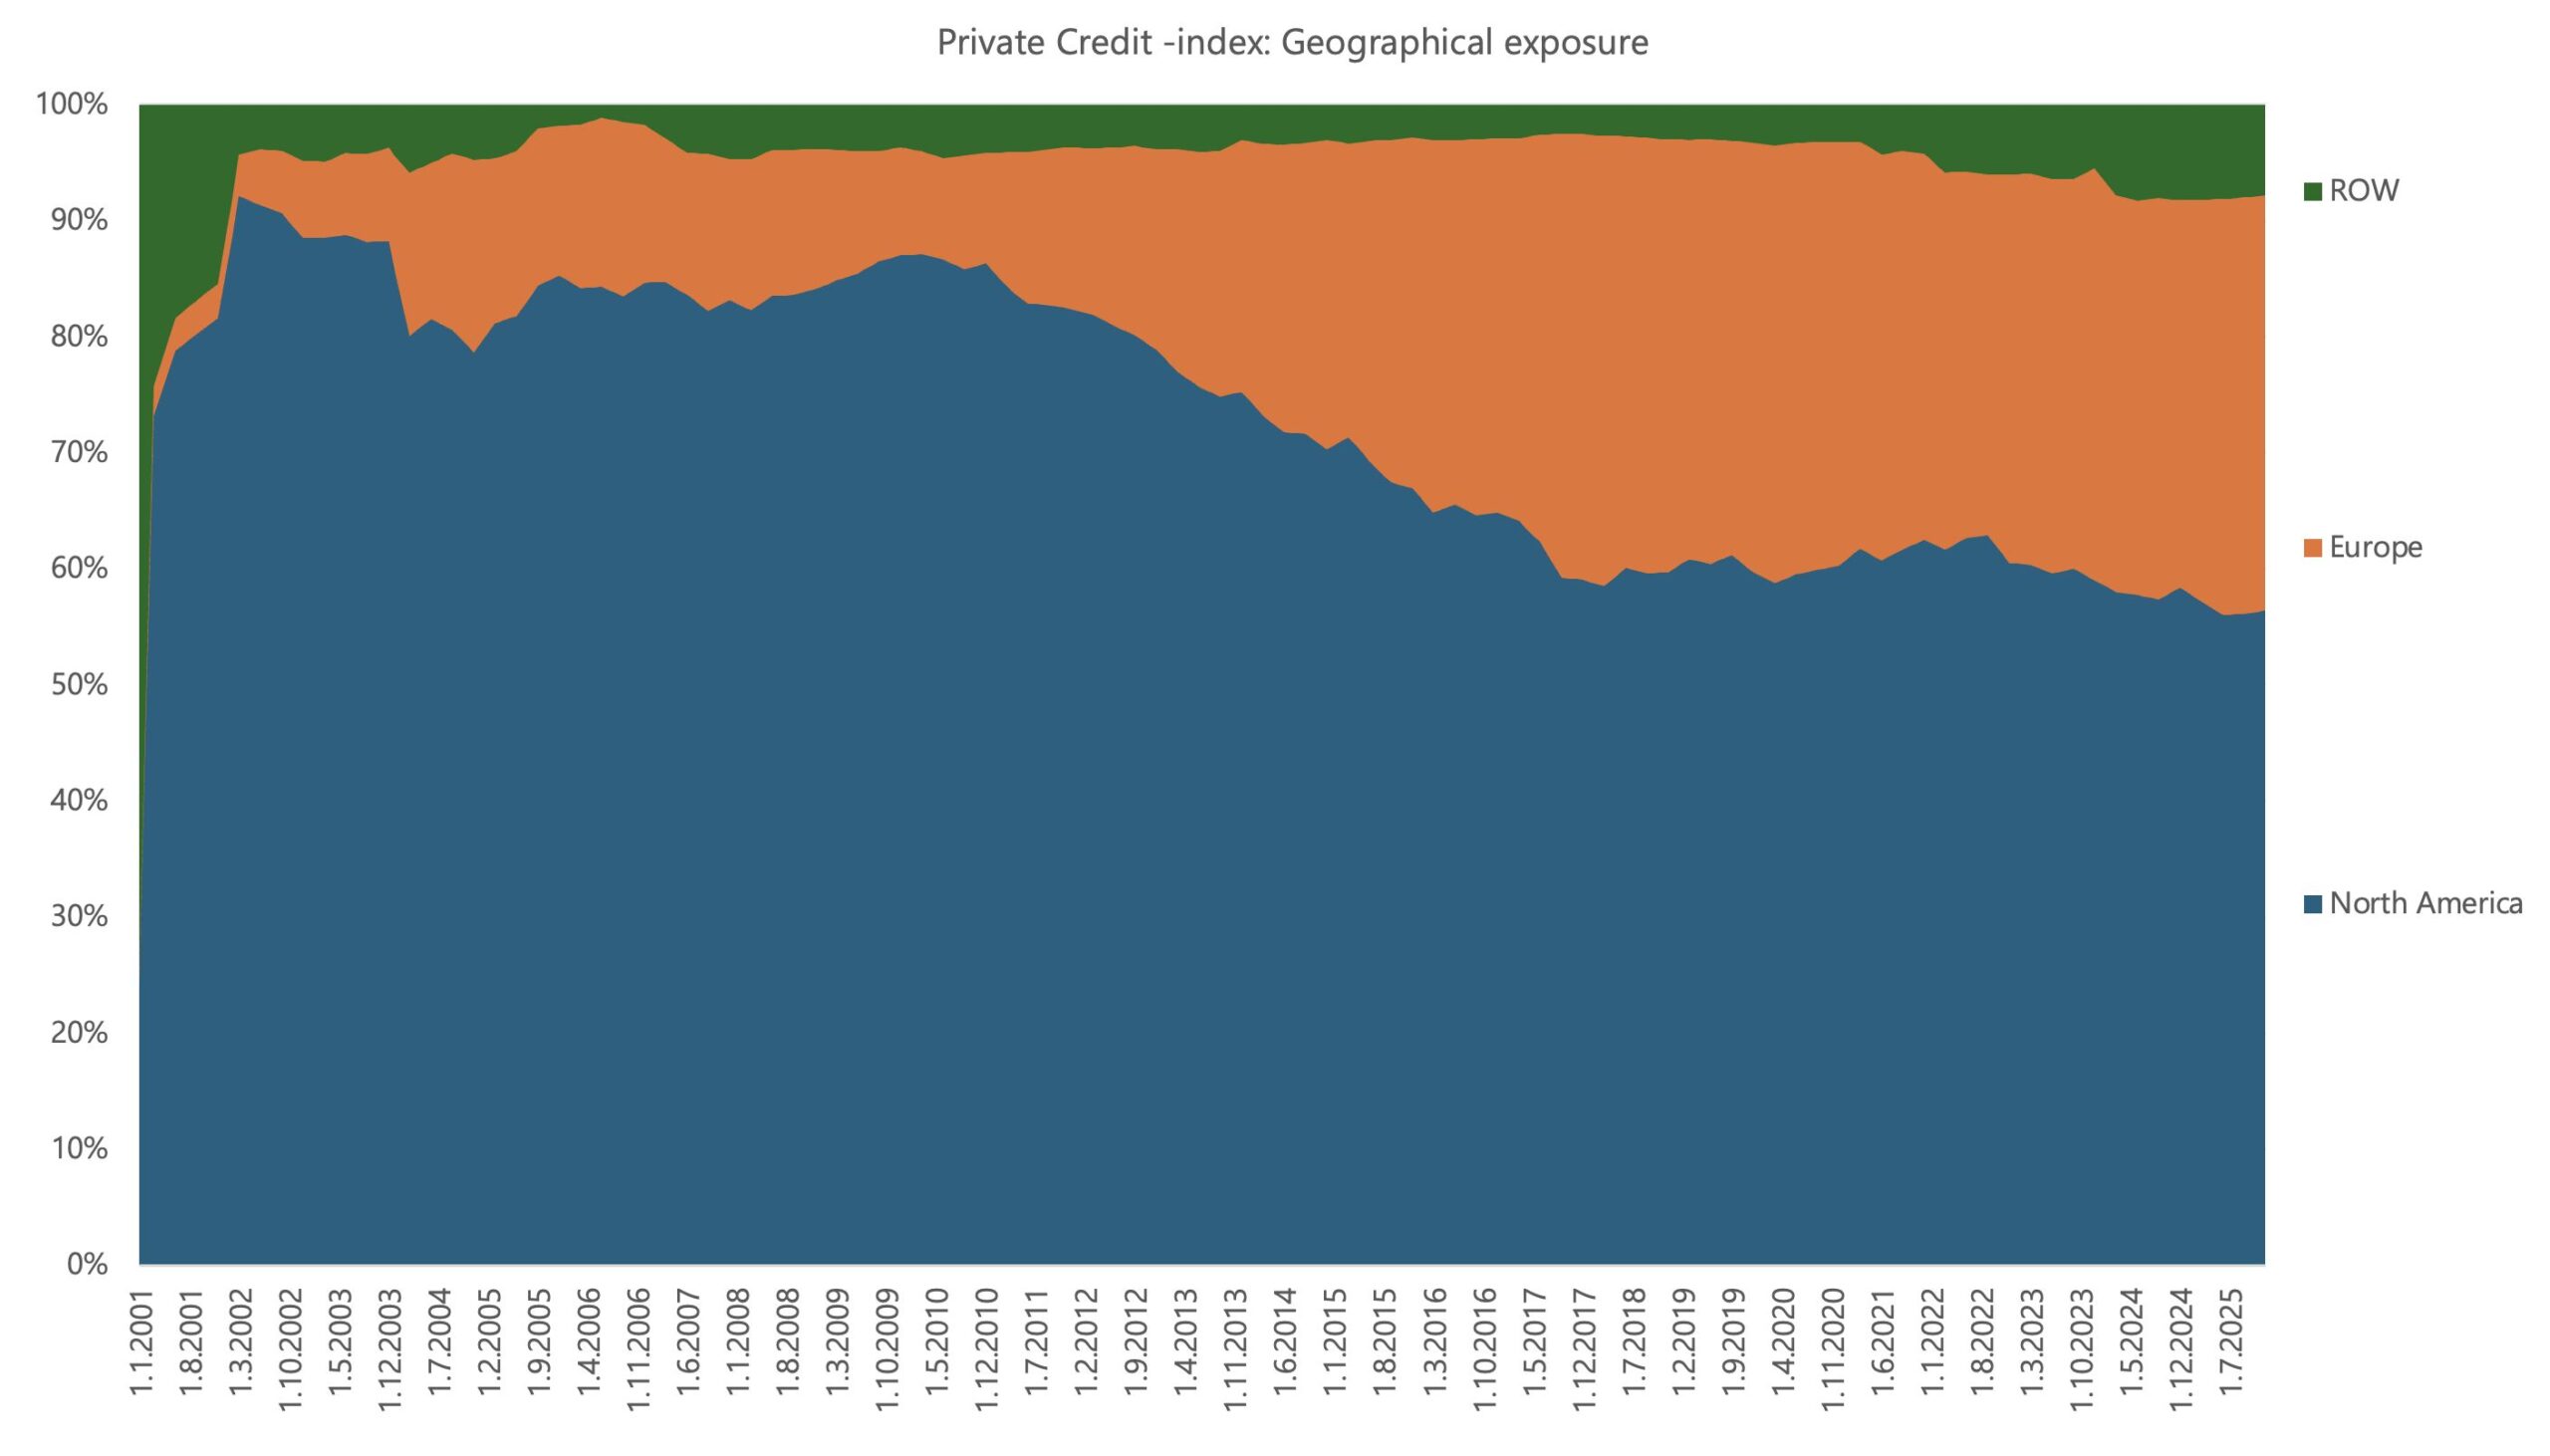
Traditionally, US direct lending investors have gained exposure to the asset class through a leveraged equity tranche, whereas European investors tend to be more risk-averse, partly because of regulatory constraints, and have generally accessed the strategy without leverage.
Leveraged direct lending performed well in a zero-interest-rate environment characterized by an absence of credit defaults. Consequently, when European investors examine the returns of the Preqin Private Debt Index, they should bear in mind that most of its direct lending exposure comes from North America and is leveraged. This means that the index reflects realized returns that are substantially higher than those of its European counterpart.
Final Thoughts
Indices are convenient and straightforward tools for presenting the historical performance of an asset class. They condense a great deal of information into a single chart and make it easier to compare different asset classes. Investors should nevertheless understand what is being compared and how. In private markets in particular, it is essential to look beyond the headline figures.
A commercially motivated – or uninformed – market participant can easily present a misleading picture, potentially leading investors to make poor investment decisions. As with all investing, the message is simple: keep a cool head, think clearly, and always look beyond the headline or top-level figure. There is likely to be far more information beneath the surface to support an investment decision than some market participants would like you to see.
