

By Luc Dumontier, CIO Global Asset Management, iM Global Partner: Rarely have global portfolios carried such concentrated exposure to a single bet. US equities remain historically expensive and unusually concentrated, and with the equity-bond correlation having turned positive, bonds now offer less of a cushion than investors have come to expect. This makes the case for a genuine third source of return more compelling than ever. Below, we explain why two liquid alternatives, equity long/short and managed futures, are particularly well suited to this moment, and why implementation ultimately determines whether investors actually capture the diversification they’re seeking.
A good time to look for additional sources of diversification
The US equity market accounts for the bulk of global market capitalisation, and it is both historically expensive and unusually concentrated. The cyclically adjusted price-to-earnings (CAPE) ratio sits above 40, a level previously seen only around the peak of the dot-com bubble (see Figure 1).
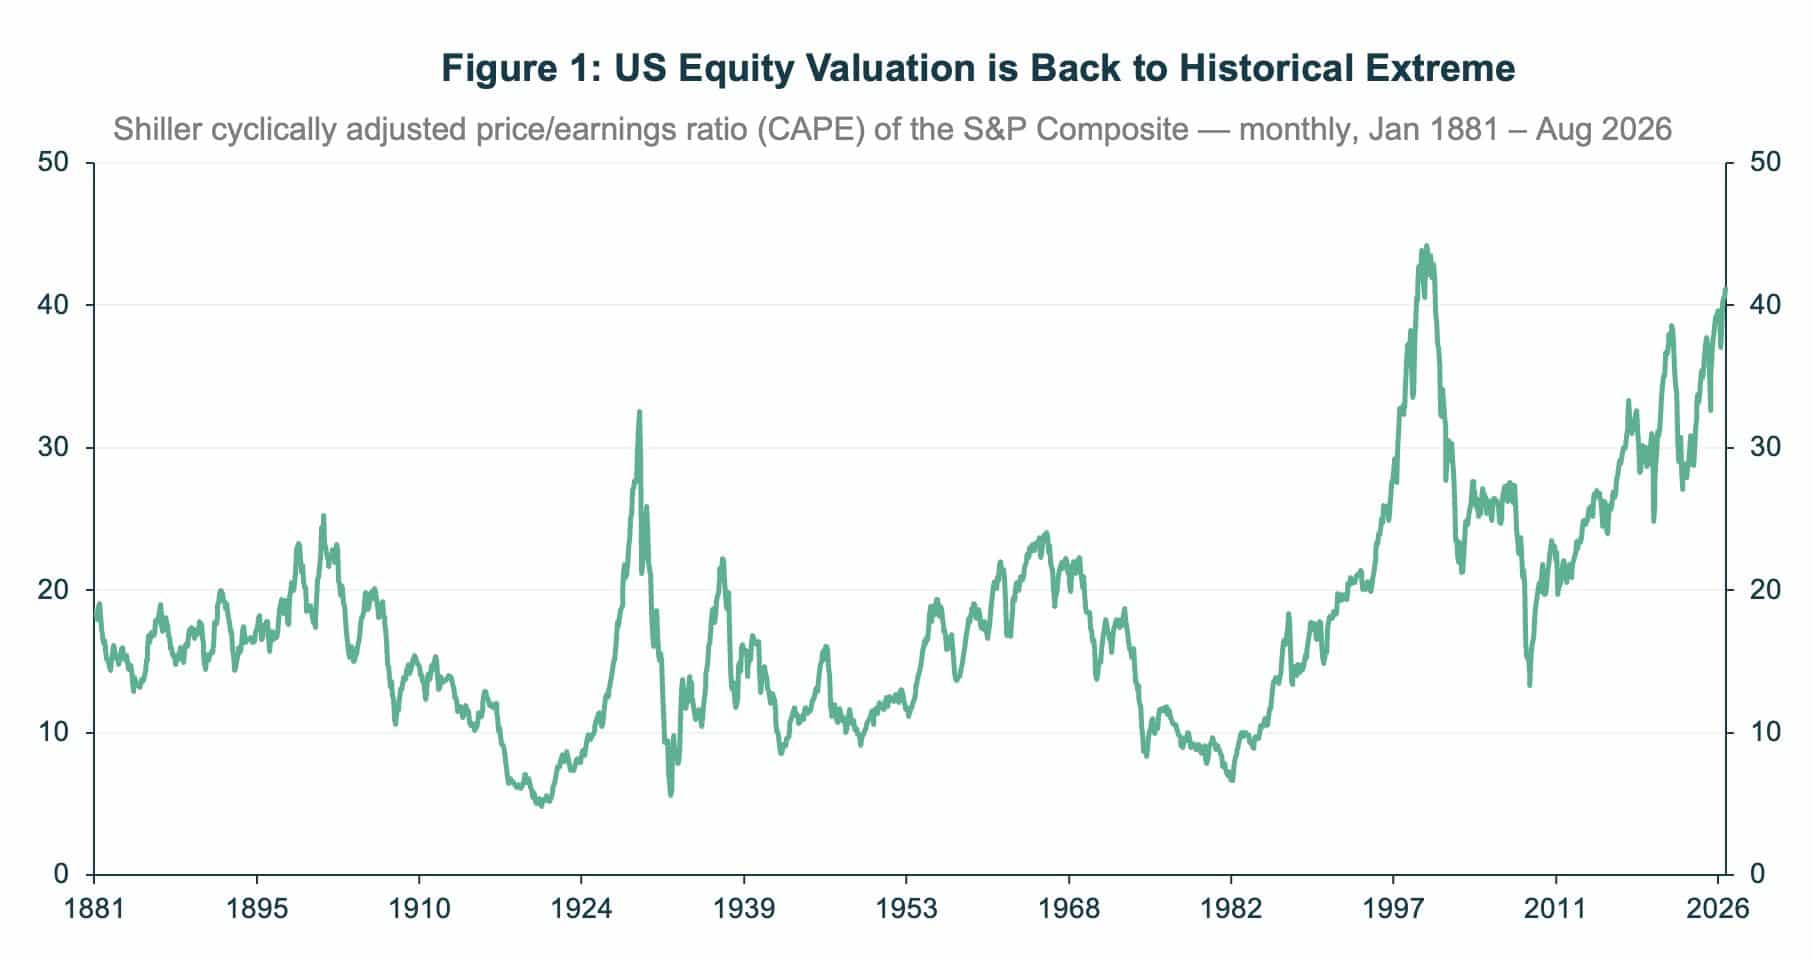
Method: CAPE = inflation-adjusted index price divided by the 10-year moving average of inflation-adjusted earnings; both series deflated by the US CPI.
Sample: 1,748 monthly observations, January 1881 – August 2026.
Past performance is not indicative of future results. For illustrative purposes only.
The US now represents more than 60% of total global market capitalisation and more than 70% of the developed-market total. Concentration within the index is just as striking (see Figure 2). The top 10 names make up roughly 40% of the market, about 50% more than at the height of the technology bubble, while the number of effective holdings has fallen close to 40, around half the figure of that earlier period.
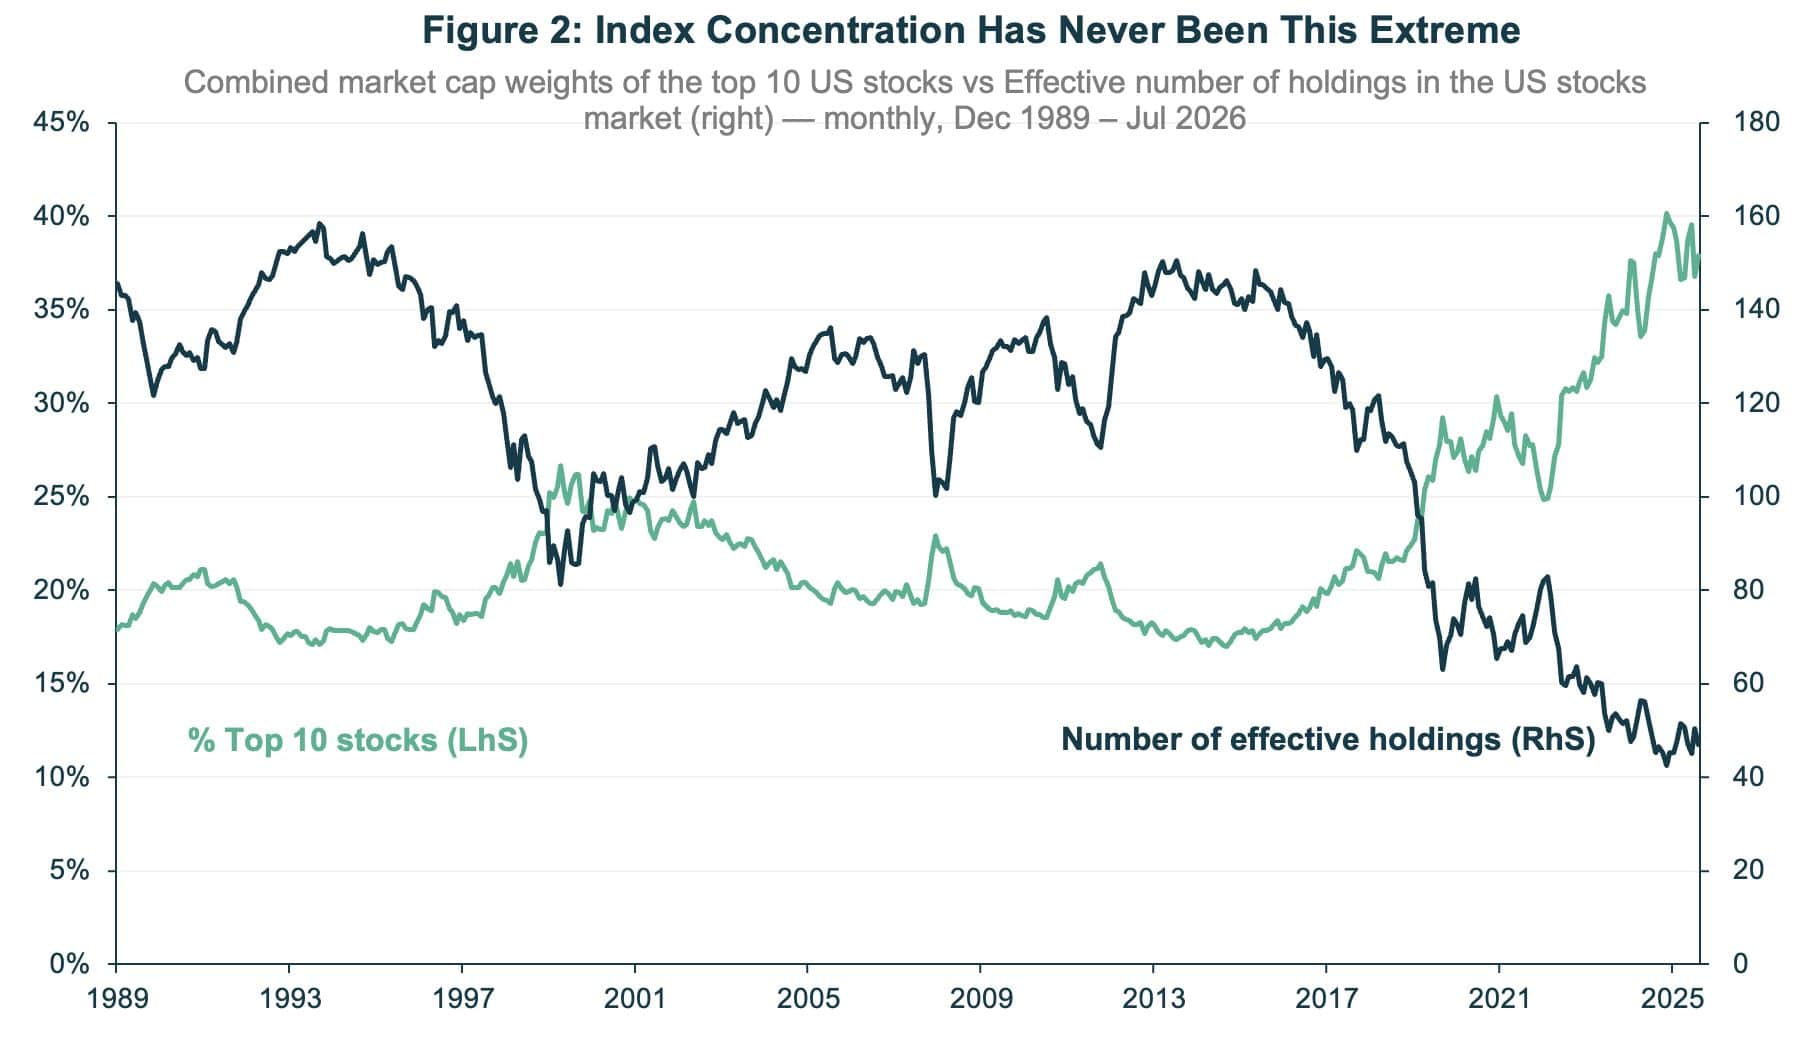
Method: Top 10 weight is the combined index weight of the ten largest constituents at each month-end (left axis).
Effective breadth is the effective number of holdings implied by the constituent weight distribution (right axis).
Sample: monthly observations, December 1989 – July 2026 (440 points).
Past performance is not indicative of future results. For illustrative purposes only.
The usual offset to concentrated equity risk has also weakened. The equity-bond correlation has recently turned positive (see Figure 3), so the diversification that fixed income traditionally provides is doing less work than investors have come to expect. Add a fragile Middle East ceasefire, persistent macro uncertainty and higher expected inflation, and the case for looking beyond the traditional stock-bond mix becomes difficult to ignore.
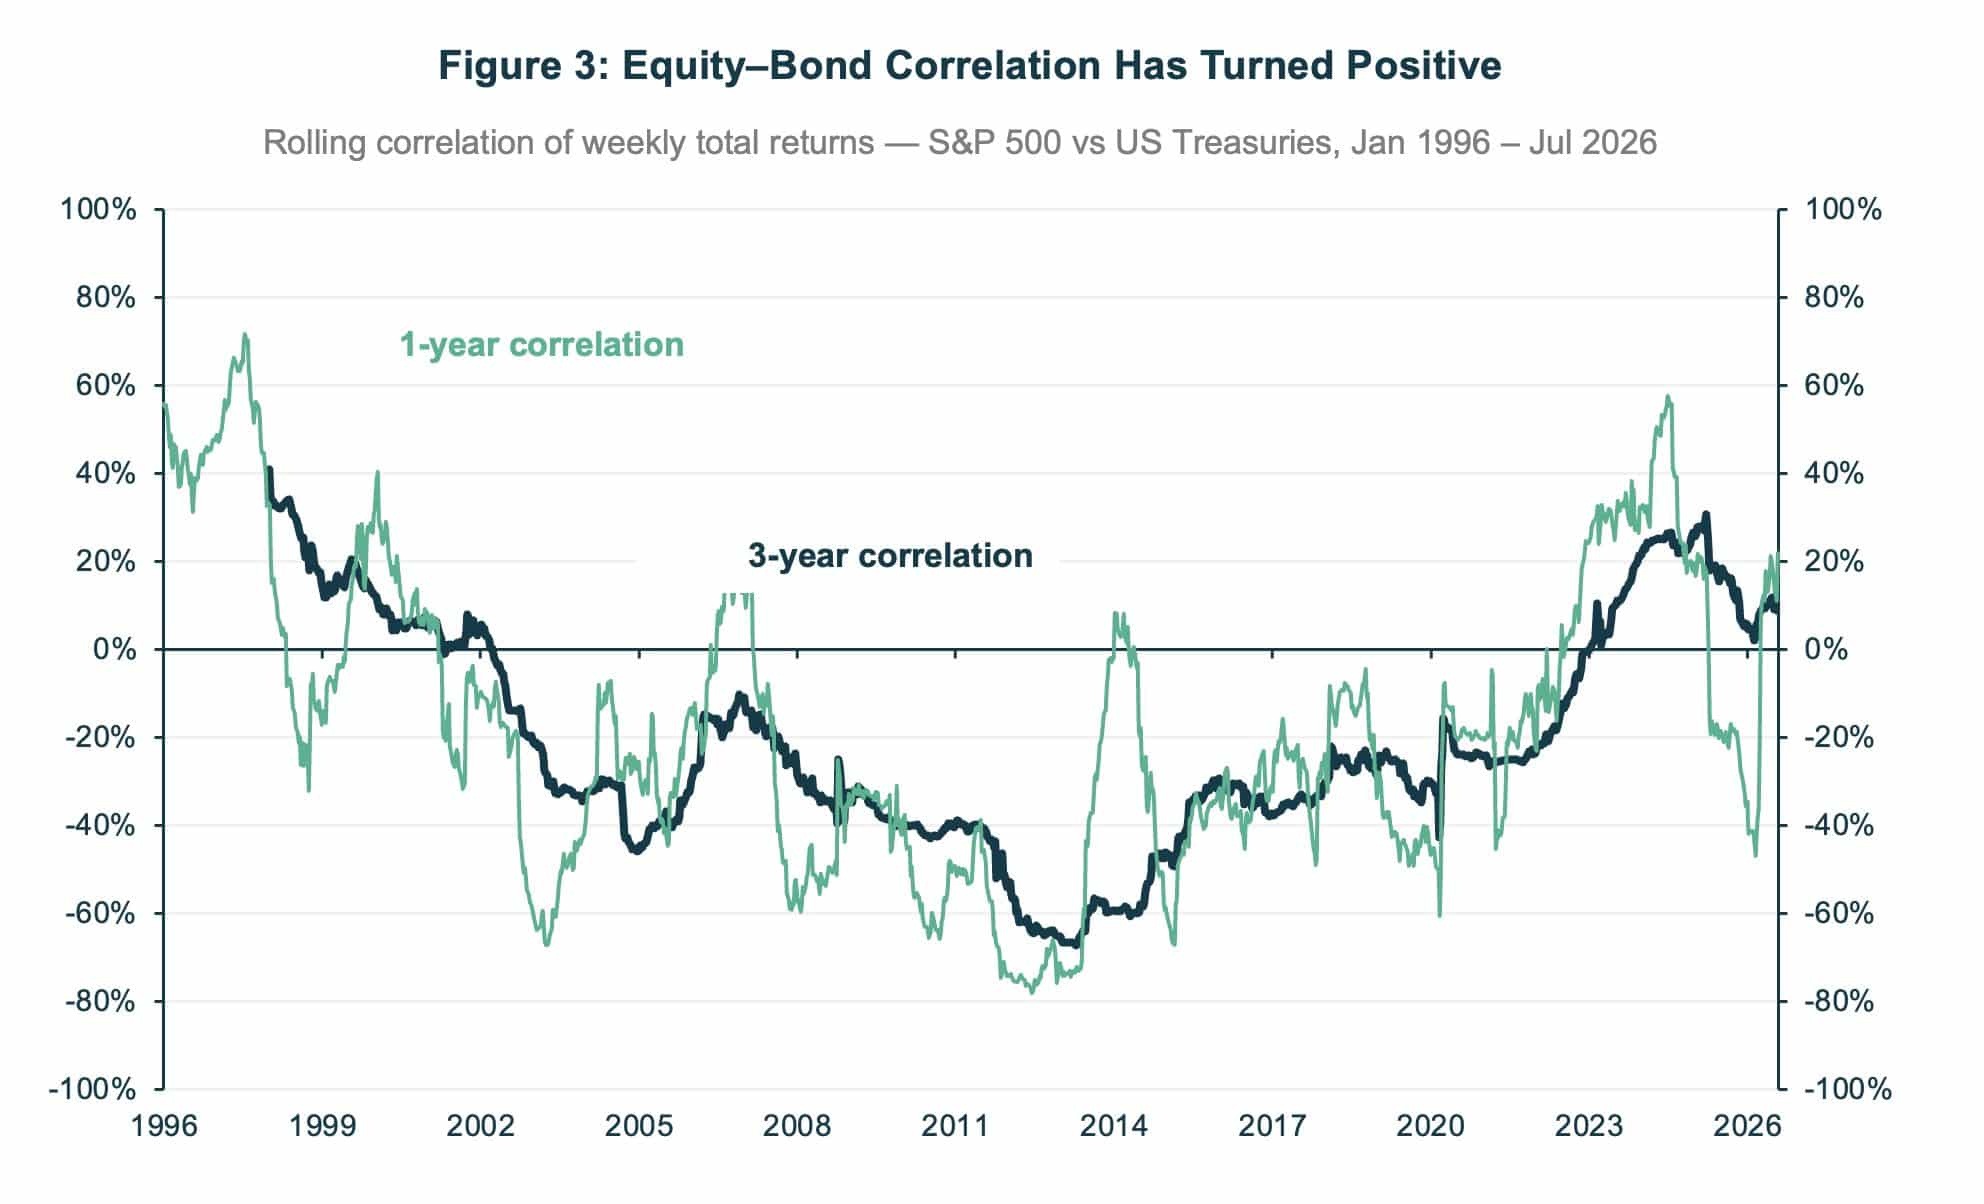
US Treasuries and Equities are proxied by the Bloomberg US Treasury Total Return Index (LUATTRUU) and S&P 500 Net Total Return Index (SPXT) respectively.
Method: weekly total returns; Pearson correlation over rolling windows of 52 weeks (1-year) and 156 weeks (3-year).Sample: 30 Dec 1994 – 31 Jul 2026 (weekly observations)Past performance is not indicative of future results. For illustrative purposes only.
When the two largest building blocks of a portfolio become more expensive and more correlated at the same time, the marginal value of a genuine third source of return rises.
Liquid alternatives aim to provide diversification
Two liquid alternative strategies stand out to us in the current context. The first is equity long/short. These strategies seek to profit from the relative performance of individual stocks by holding long and short positions at the same time, while keeping exposure to the underlying market low. The case for them now rests on dispersion: realised dispersion across individual US stock returns has widened considerably over recent quarters (see Figure 4), and that is the raw material long/short managers work with. The ground is fertile.
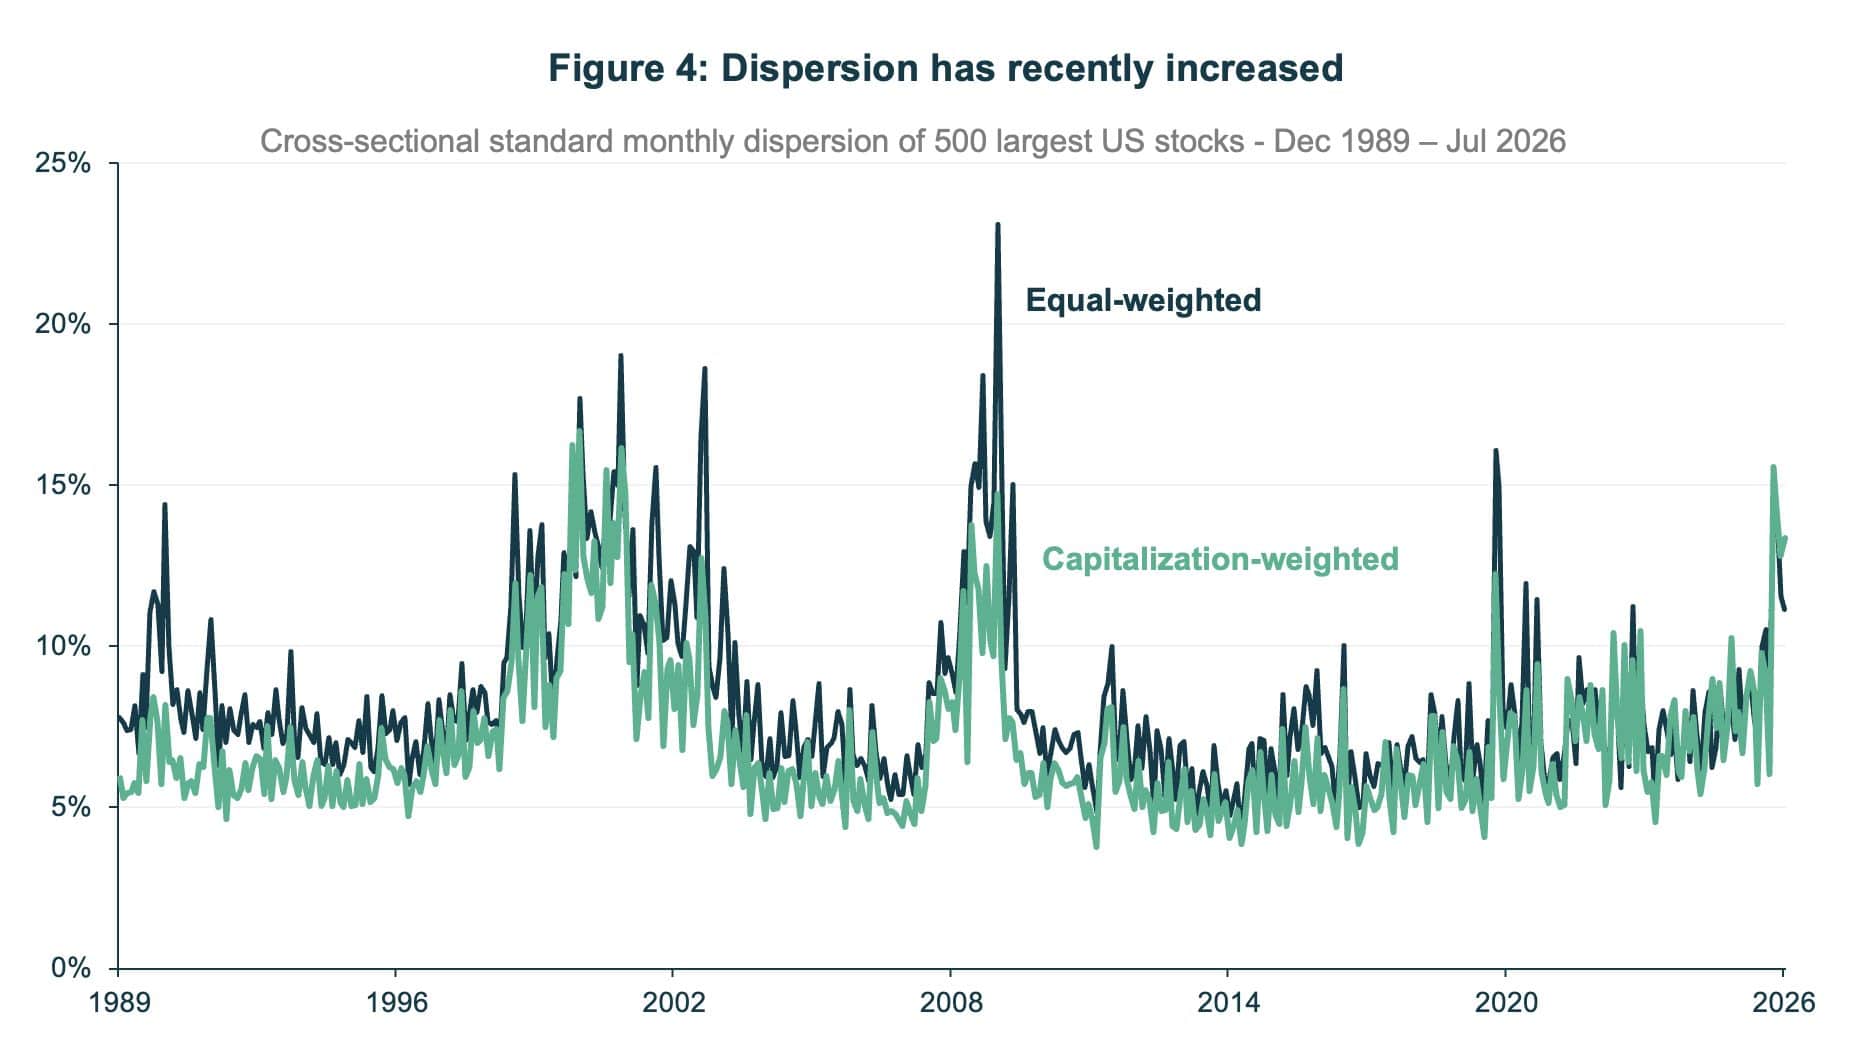
Method: cross-sectional standard deviation of constituent monthly returns at each month-end. Pale purple = equal-weighted across all constituents; green = weighted by index weight.
Monthly figures, not annualised.
Sample: December 1989 – Jul 2026 (439 month-ends, around 500 constituents per month).
Past performance is not indicative of future results. For illustrative purposes only.
The second is managed futures. These strategies seek to capture trends across asset classes, taking long positions in those that have recently performed well and short positions in those that have lagged. Historically the approach has outperformed during major market drawdowns such as the bursting of the dot-com bubble in 2000–03, the global financial crisis of 2007–09 and the inflation and interest-rate shock of 2022 (see Figure 5). With equity markets currently expensive and concentrated, and more correlated with bonds than in the past, managed futures can act as a useful hedge should conditions deteriorate.
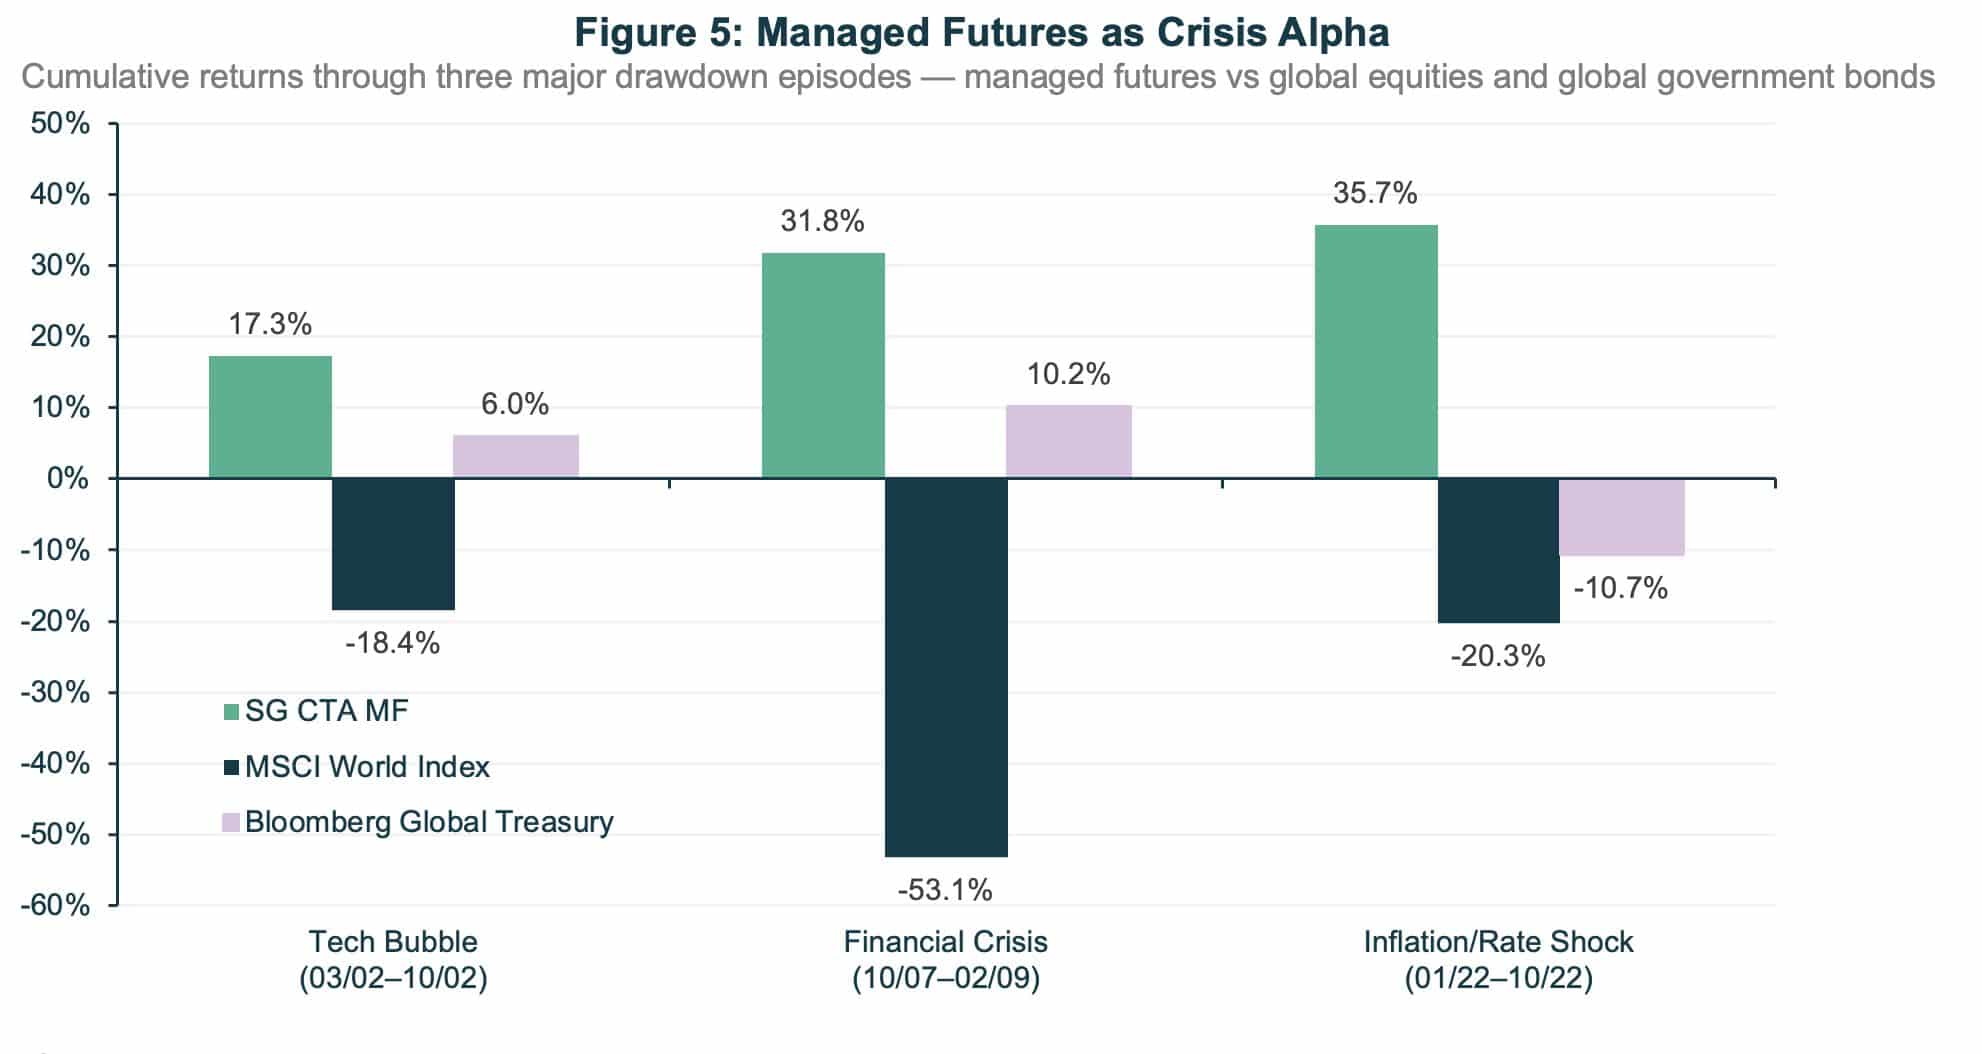
Method: cumulative total returns over each episode window shown in the category labels; SG CTA MF = SG CTA Index (net), MSCI World Index and Bloomberg Global Treasury Index in USD.
Past performance is not indicative of future results. For illustrative purposes only.
Investor appetite is following the same logic. Alternative UCITS assets have now risen for six consecutive quarters, reaching $303.2 billion; equity long/short and market neutral together added $5.4 billion last quarter, and managed futures assets grew 7% (Absolute Hedge, Q2 2026).
Investor interest is clearly building. To our minds, the harder question is how that exposure is implemented.
Beyond the label: implementation matters
A calm equity surface this summer masked one of the most violent factor rotations in decades (see Figure 6). Since 22 June 2026 the S&P 500 has been close to flat, yet the long/short momentum factor fell 29.9% while the long/short value factor gained 14.3%. That is a spread of more than 40% in two months between two unlevered long/short portfolios, neither of which carries any market exposure. The rotation reflects a partial unwind of the “AI winners” versus “AI-at-risk” theme.
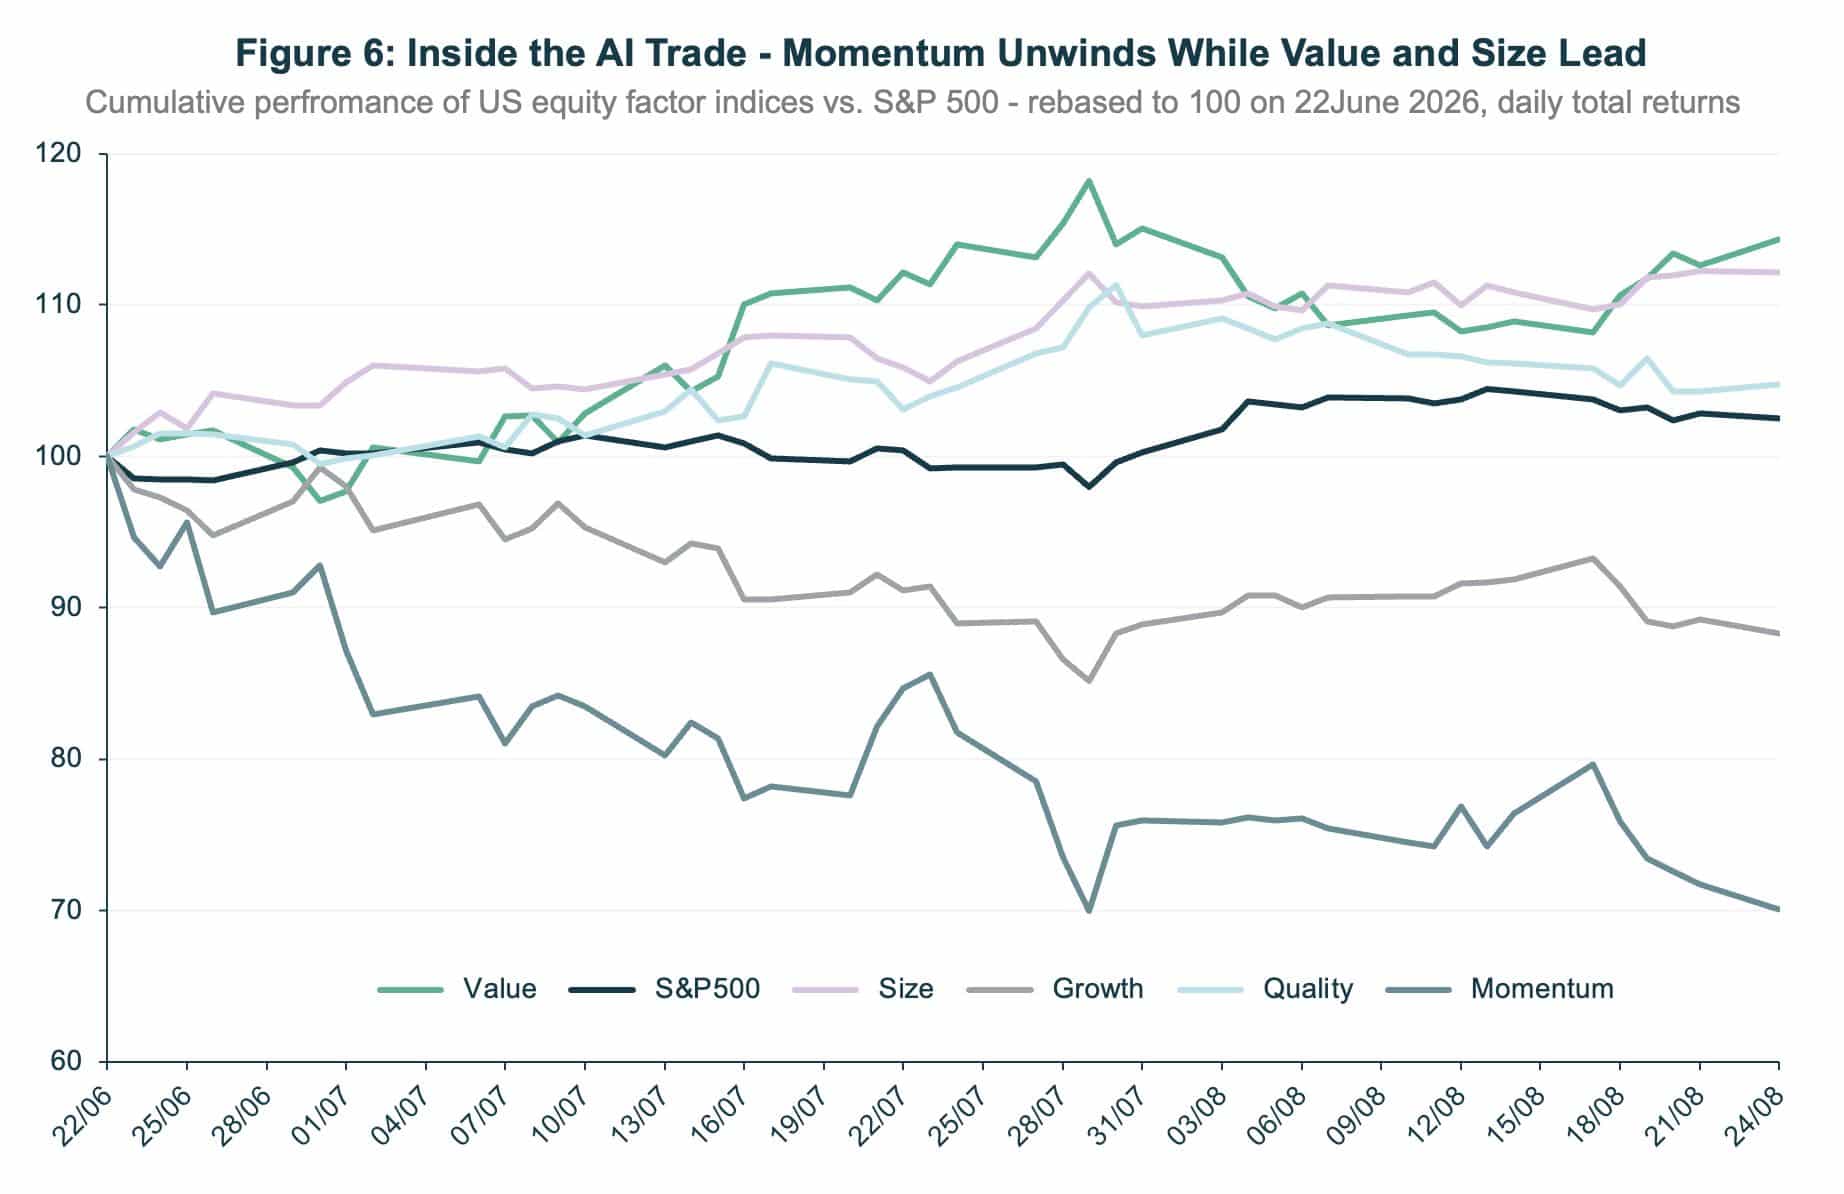
Method: each line rebases the index level to 100 on 22 June 2026 and compounds daily total returns; factors shown are Momentum, Value, Quality, Growth and Size, with the S&P 500 (net total return)
Past performance is not indicative of future results. For illustrative purposes only.
Some quantitative funds whose return engine leans on traditional factors suffered accordingly, and funds with pronounced sector or factor biases more generally were caught out by the volatility. Approaches with limited sector bias and a strong emphasis on idiosyncratic positions look better placed to navigate this environment. The iMGP Sirios Absolute Return Fundfits that description; it is constructed as six sector-based long/short sleeves, and it proved notably resilient over the period.
The managed futures industry is similarly heterogeneous (see Figure 7). Calendar-year return gaps between the best and worst performers regularly exceed 20%, and there is no persistence in which calibration works best – that is, in the optimal look-back window.
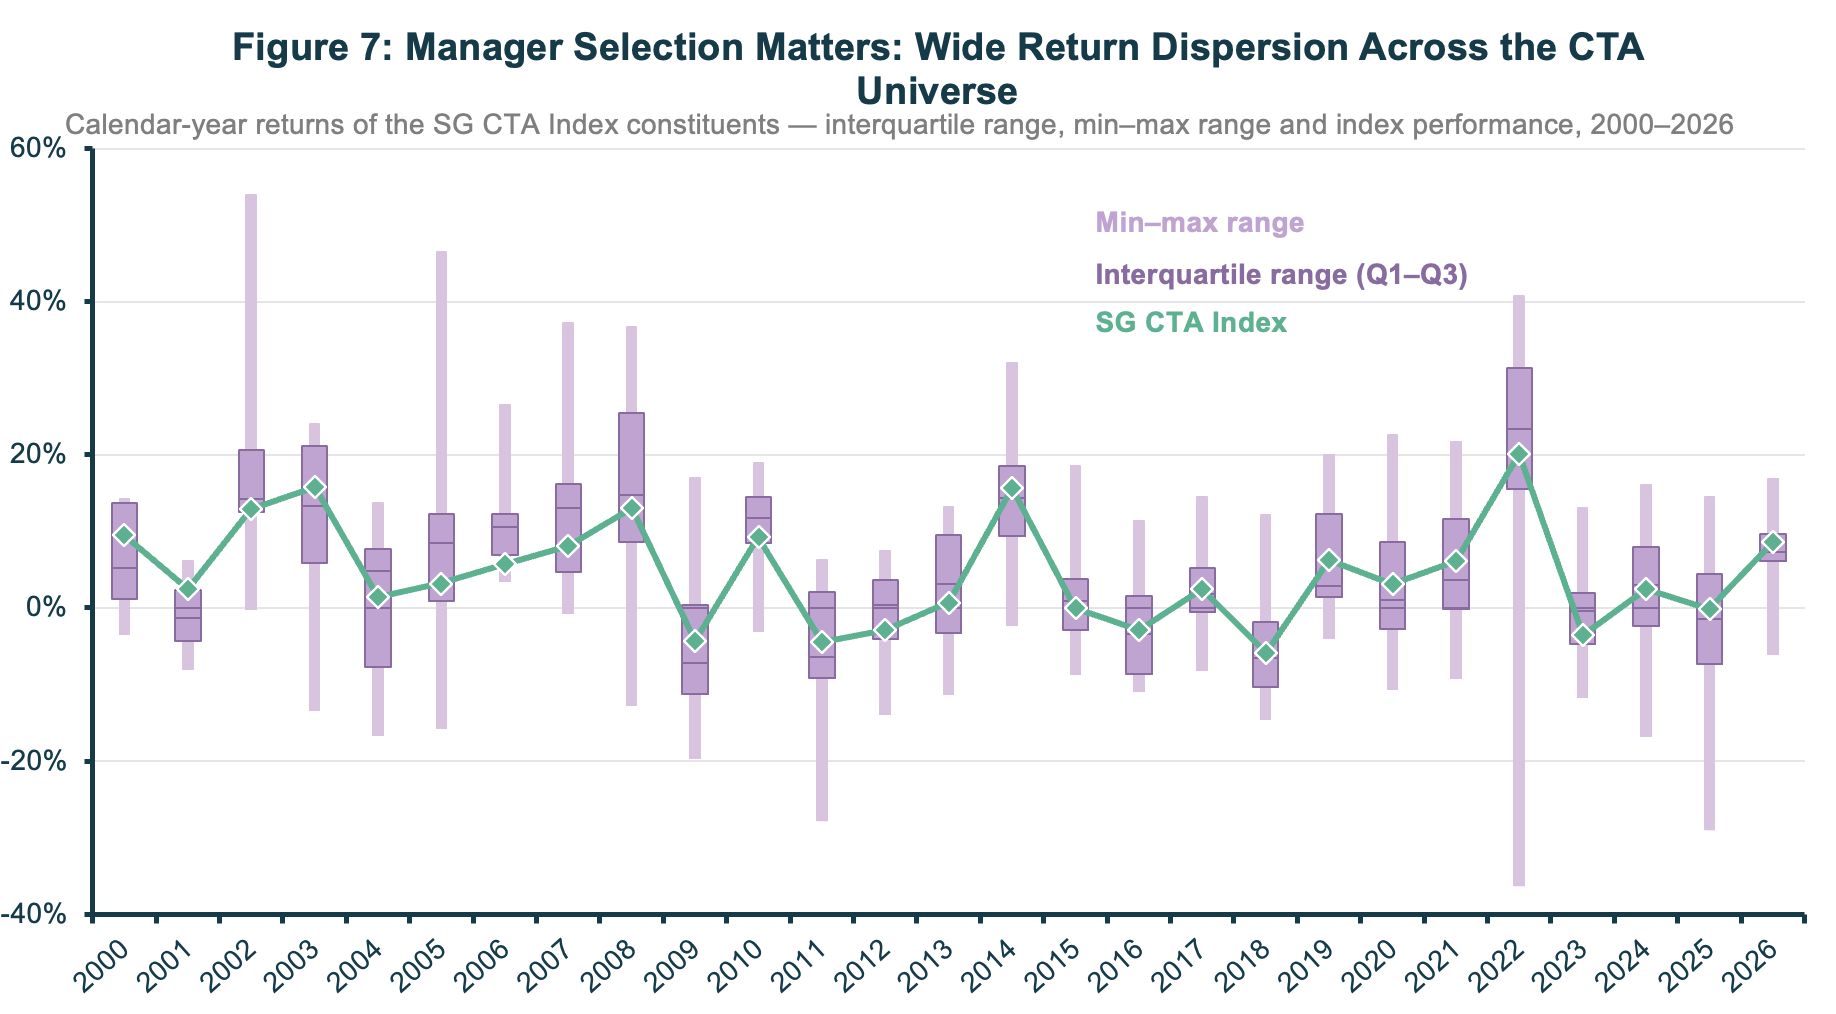
Method: calendar-year net returns of each constituent. Box = interquartile range (Q1–Q3) split at the median; whiskers = universe min and max; green line/diamonds = SG CTA Index.
Sample: 2000–2026
Past performance is not indicative of future results. For illustrative purposes only.
Our conclusion is that idiosyncratic risk should be minimised within this universe. The iMGP DBi Managed Futures strategy is built around that principle, replicating the industry’s core return drivers while arbitraging away the fee load that traditional CTAs carry. Since launch, its net return series has tracked at or above the SG CTA Index and has sat toward the upper end of the peer group (see Figure 8).
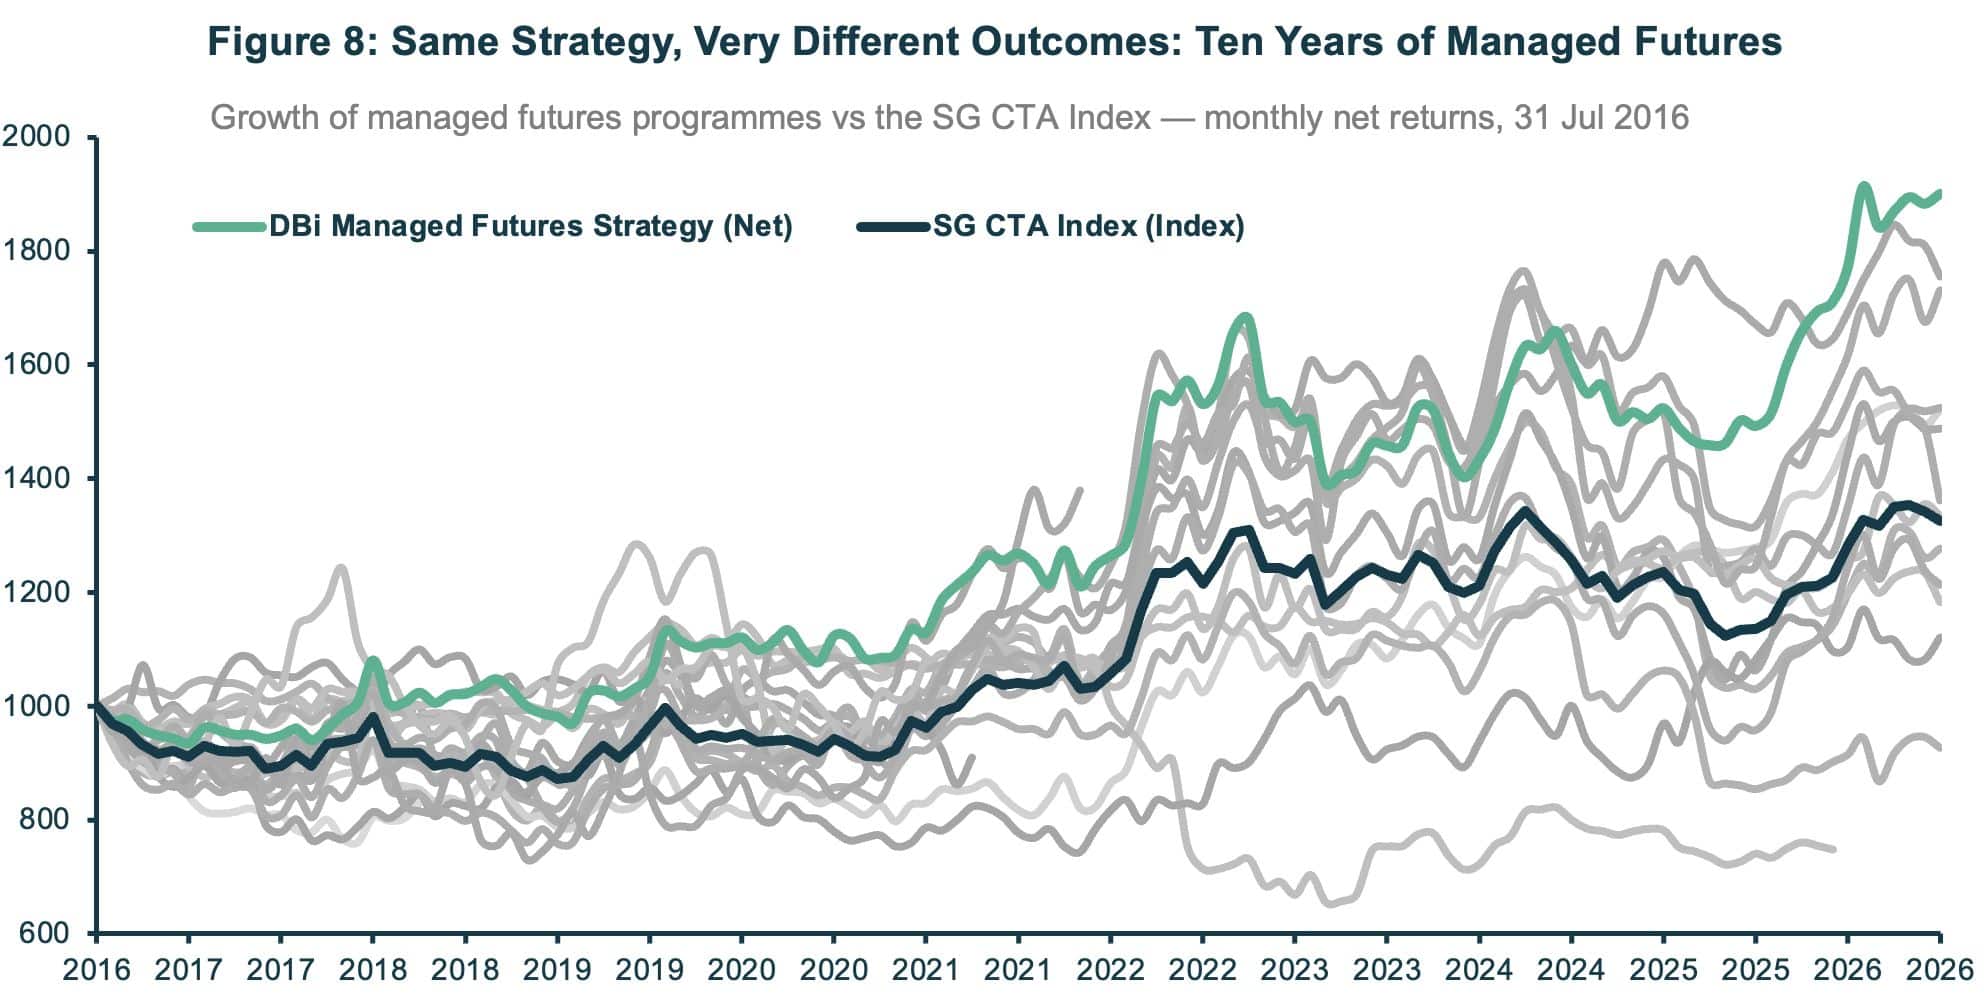
Method: each line compounds monthly net returns from a base of 1,000 on 31 July 2016. Grey = 19 individual managed futures programmes; green = DBi Managed Futures Strategy; dark teal = SG CTA Index.
Sample: 31 July 2016 – 31 July 2026 (121 monthly observations).
Past performance is not indicative of future results. For illustrative purposes only.
Beyond performance: liquidity and transparency matter
Performance is not the only test. Investors are rightly seeking liquidity and transparency, and both strategies are built with those constraints in mind. DBi expresses its views through a concentrated set of highly liquid futures contracts, while Sirios caps single-name short exposure at no more than 1%. That discipline is precisely what allows us to offer each strategy in both mutual fund and ETF formats.
Two strategies, now available as ETFs
Both strategies are now available to European investors in UCITS ETF form, alongside their existing mutual fund share classes.
iMGP DBi Managed Futures Fund (DBMF FP)
- Listed on Euronext Paris under DBMF FP, the London Stock Exchange under DBMF LN and DBMG LN, and Xetra under DBMF GY and MFEH GY.
- Actively managed, Luxembourg-domiciled UCITS ETF; listed 14 March 2025; ongoing charges of 0.75% and no performance fee.
- Replicates the pre-fee performance of a representative basket of leading managed futures managers, expressed through 10 highly liquid futures contracts; sub-managed by DBi.
- Mirrors iMGP’s US-listed managed futures ETF, the largest managed futures ETF globally.
iMGP Sirios Absolute Return Fund (SARF FP)
- Listed on Euronext Paris under SARF FP, and also admitted to trading on the London Stock Exchange.
- Actively managed, Luxembourg-domiciled UCITS ETF; launched 7 April 2026; ongoing charges of 1.20% plus a 20% performance fee.
- A US equity long/short strategy with low net exposure, run by six sector-specialist analysts across equally weighted sleeves; sub-managed by Sirios Capital Management, founded in 1999.
Why an ETF version of an established fund?
The first reason is access. The ETF wrapper broadens the range of investors who can reach these strategies. A single listed line can be bought through a standard brokerage account, without the operational steps a fund subscription can require, which opens the strategies to wealth platforms, discretionary managers and self-directed professional investors who prefer listed instruments.
The second is intra-day dealing. Mutual fund share classes price once a day; an ETF trades throughout the session at a live price. That lets investors enter, exit or rebalance when they choose rather than waiting for a daily cut-off, and it makes the strategies straightforward to use tactically alongside other listed holdings.
The final and most important rationale is the fit between the strategies and the wrapper itself. Both strategies are well suited to an ETF because they are liquid and transparent by construction. DBi holds only a concentrated set of exchange-traded futures, and Sirios keeps single-name short exposure below 1%, so the underlying books are liquid and readily managed intra-day. Combined with the daily portfolio transparency and the regulated UCITS framework the ETF provides, investors obtain the diversification these strategies are designed to deliver in a format whose liquidity and disclosure match the way they increasingly want to hold alternatives.
In short, an ETF launch allows us to offer the same strategies investors already know and trust, delivered in the wrapper many now prefer.
