

By Steven Braun at Newfound Research and Return Stacked® Portfolio Solutions: Long-only active management traditionally has two levers for generating excess returns. The first is security selection: owning securities in a different weight than the benchmark. The second is allocation: taking more or less industry, sector, geographic, or asset class exposure than the benchmark.
Nearly every actively managed fund pulls one or both of those levers, whatever wrapper it arrives in. Both draw their active return from inside the benchmark.
Isolating a manager’s active bets is trivial. Subtract the benchmark weights from the manager’s weights and what remains is a set of over- and underweights that sum to zero. Functionally, the manager is equal to the benchmark plus a long/short portfolio: the overweights are the longs, the underweights are the shorts.
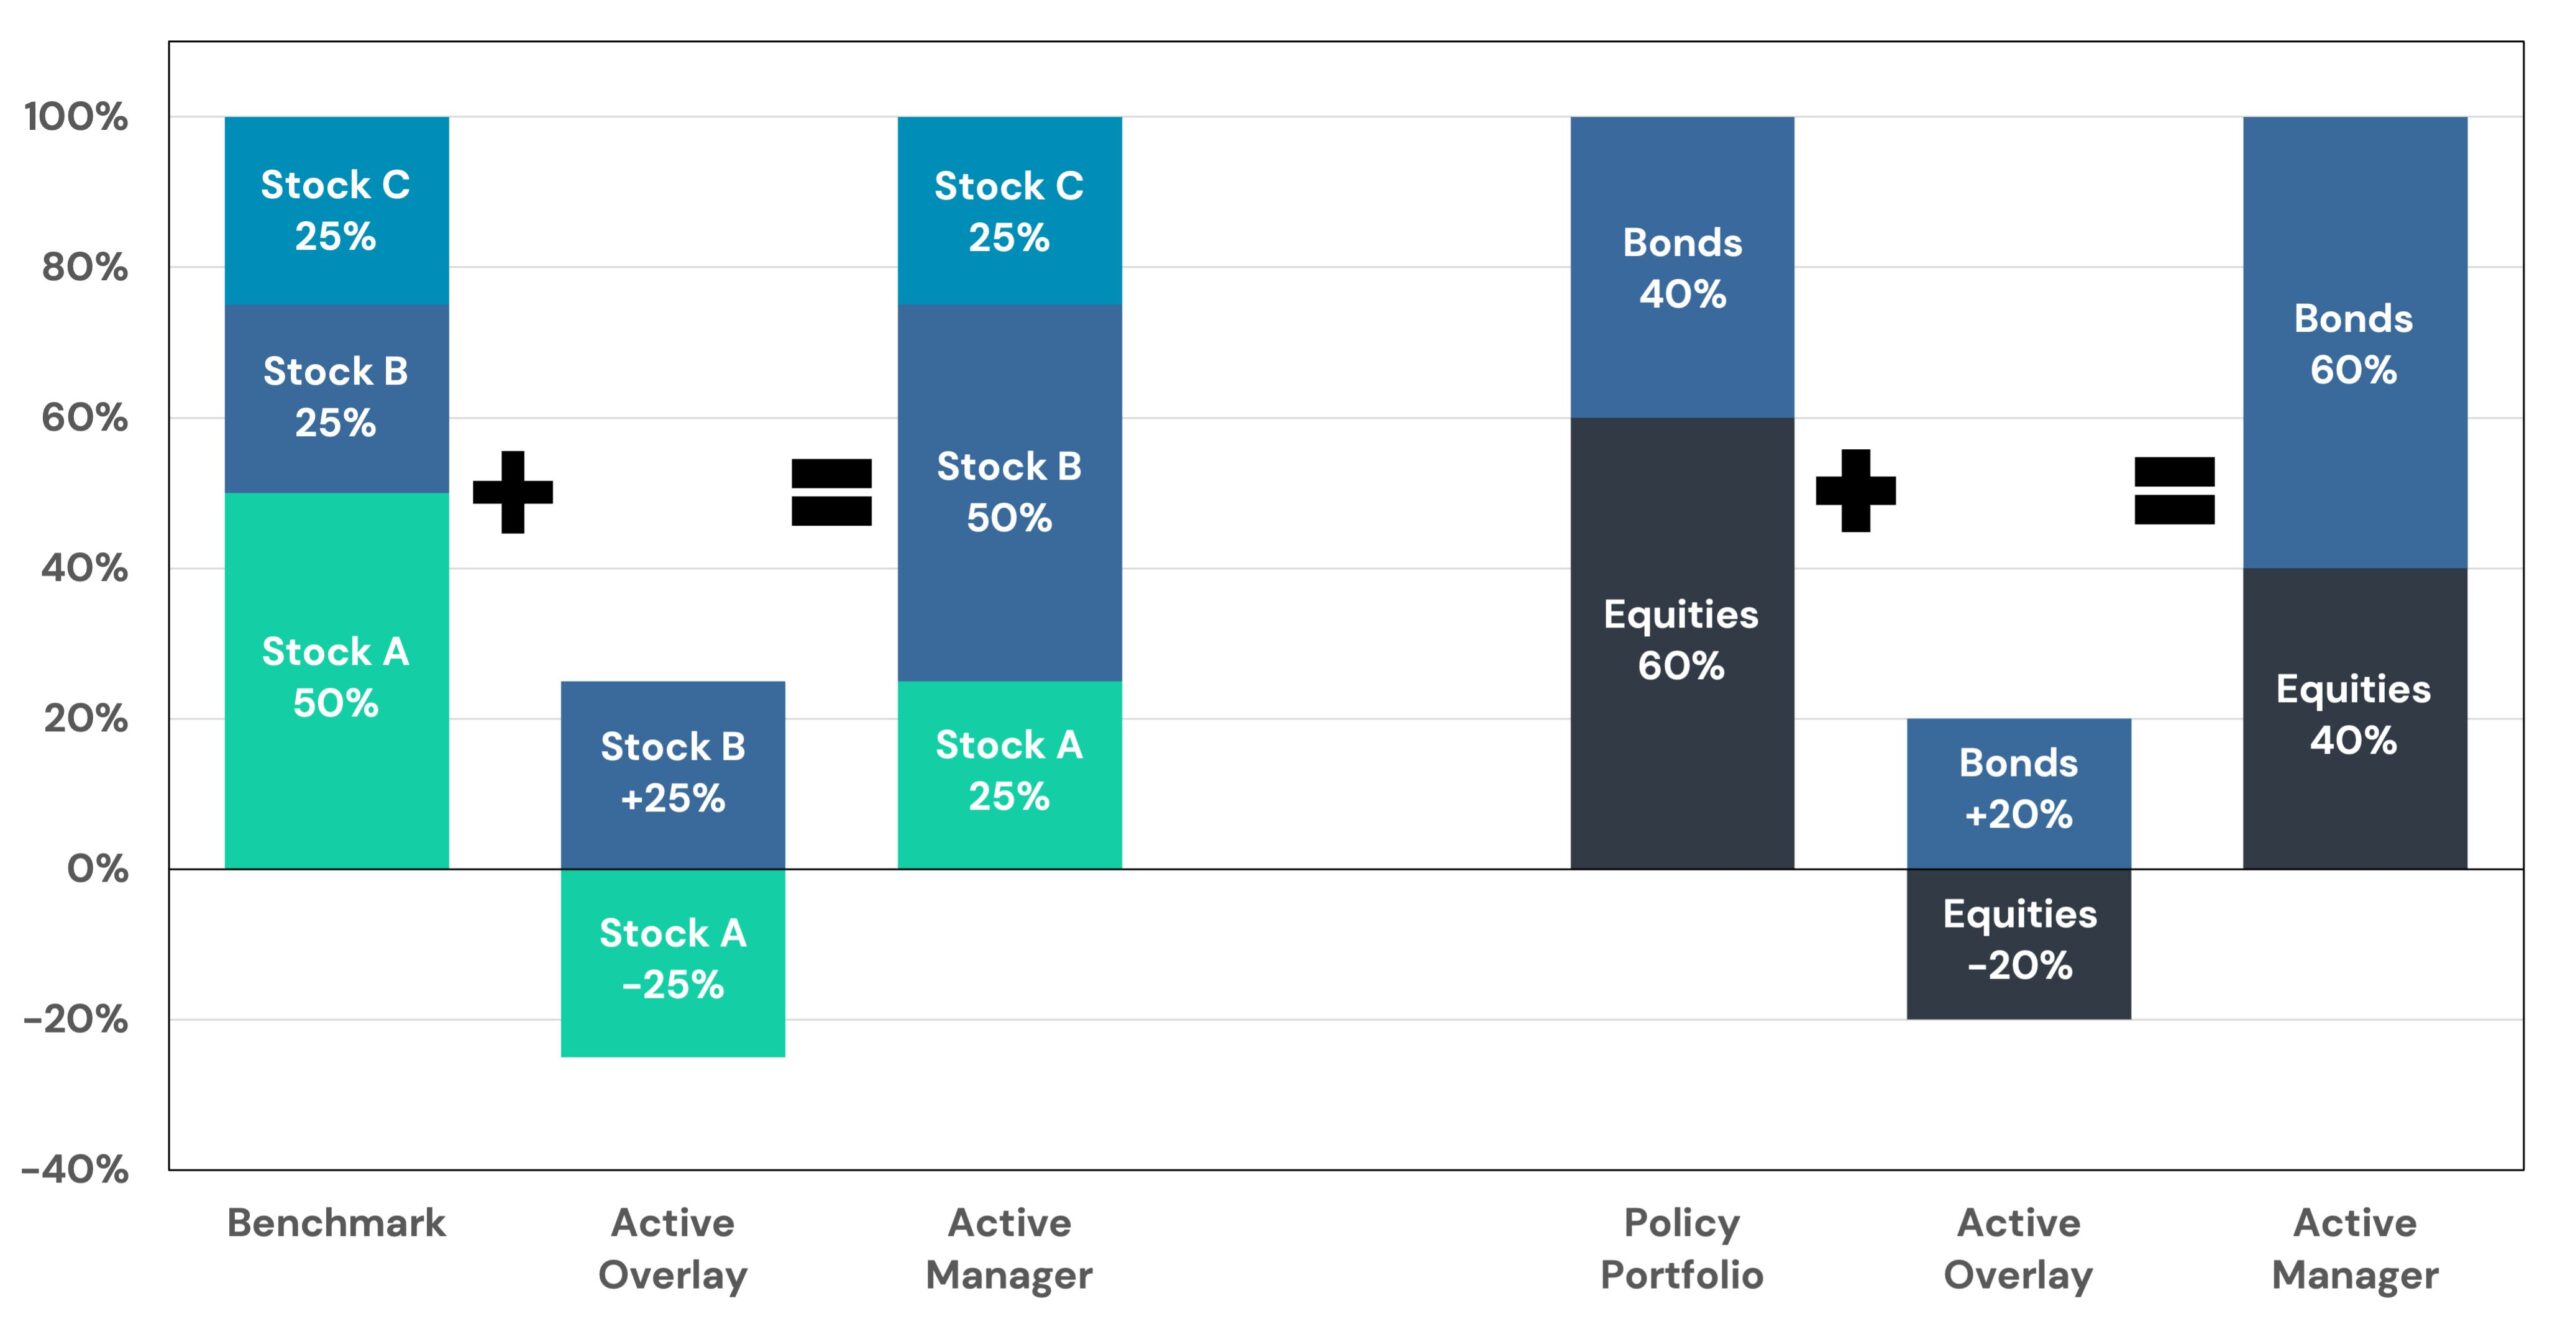
The same arithmetic holds at any level of aggregation. A tactical allocator who trims equities to add duration owns the policy portfolio plus an overlay that is long bonds and short equities.
An active fund, then, is two positions: the benchmark and an implicit long/short overlay laid on top of it. Both sides of that overlay are bounded, though. A position can only be sold to zero, which caps the short and, because the sale funds the purchase, caps the long along with it.
But what if a third lever could be pulled independently of the benchmark, free of the weights that bind the other two?
Five Factors and One Mystery
In Exhibit 2, we extract six long/short overlays available to a global equity investor and show the calendar year returns for each.
Five are the implicit overlays inside familiar long-only equity factor tilts: size, value, momentum, quality, and minimum volatility. The sixth we have left a mystery for now.
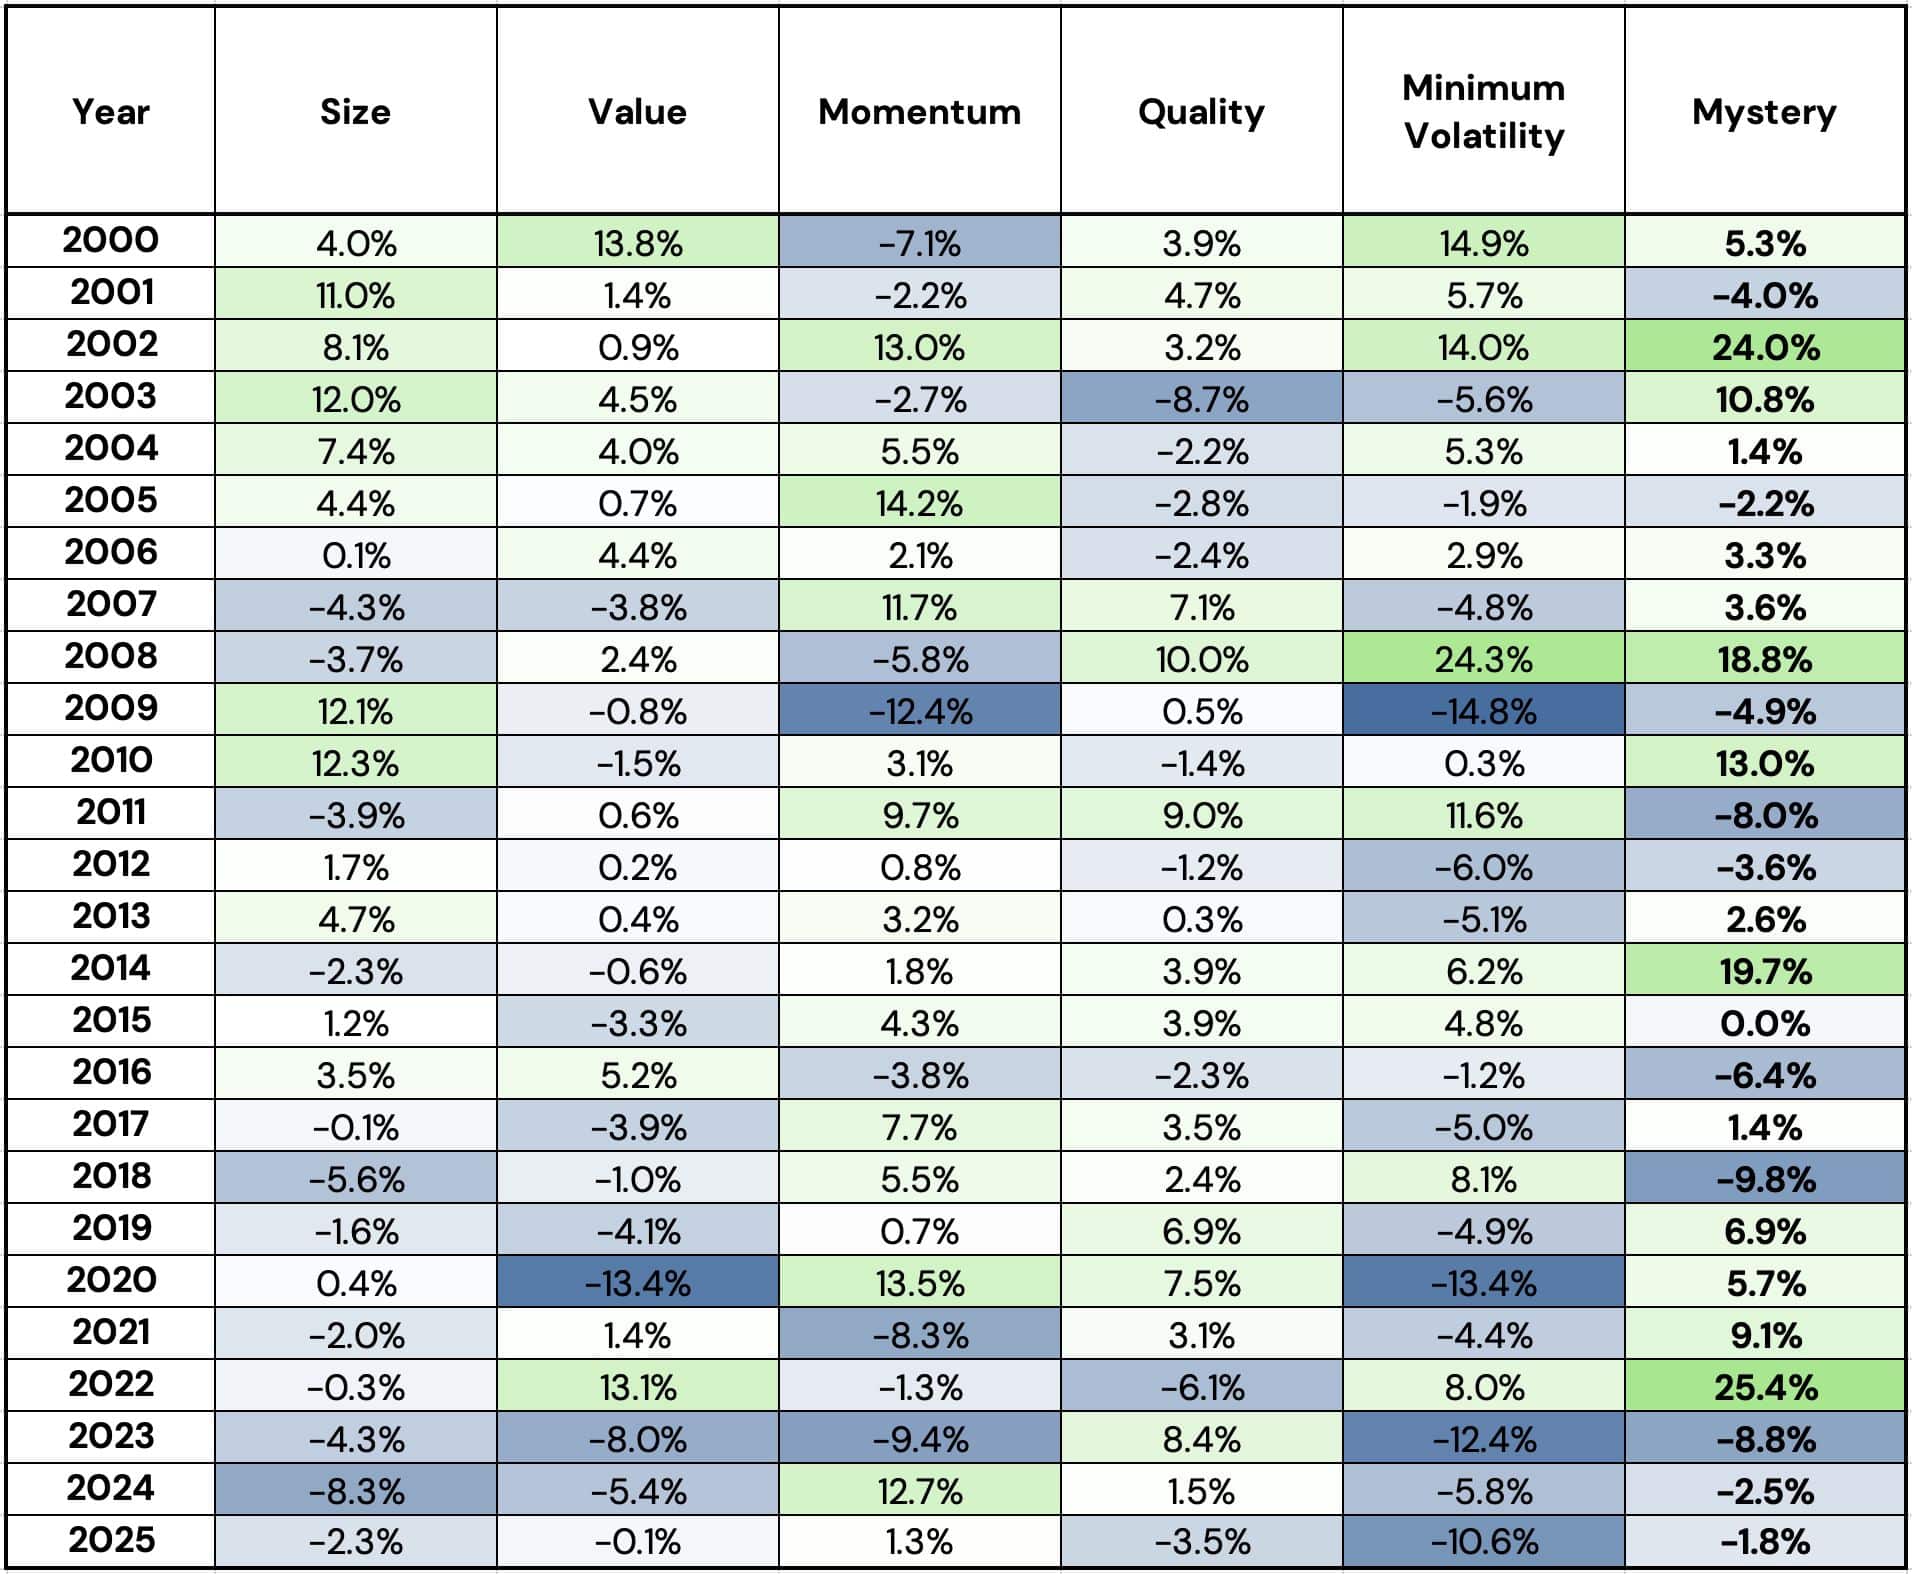
At first glance, the mystery overlay appears to hold impressive defensive characteristics (alongside quality and minimum volatility in most cases) with positive returns in 2002, 2008, and 2022, the three worst years for global equities over this period.
The volatilities of the overlays themselves vary widely, however, from roughly 13% for the mystery factor down to 4% for value. For a more direct comparison, Exhibit 3 shows summary statistics and cumulative excess returns for each overlay, scaled to the same 5% target annualized volatility.
Exhibit 3: Summary Statistics and Cumulative Excess Return of Each Overlay, Scaled to 5% Tracking Error.
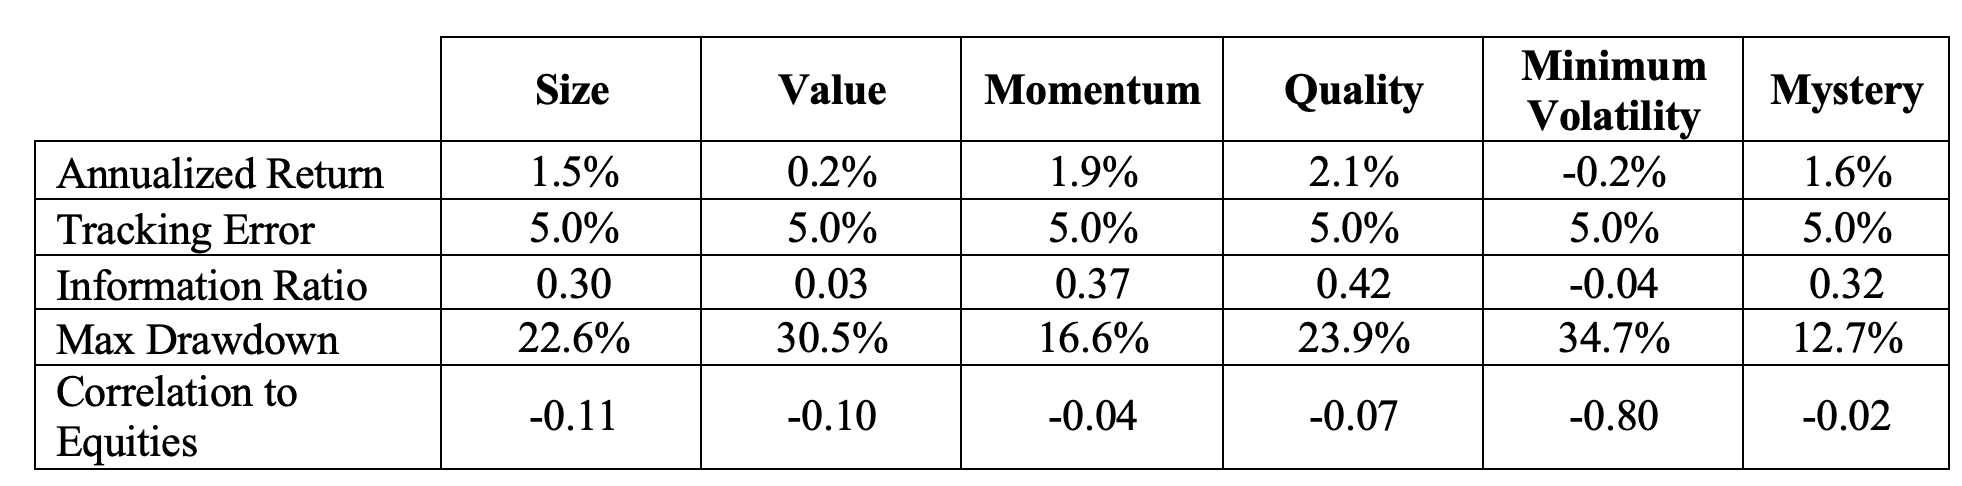
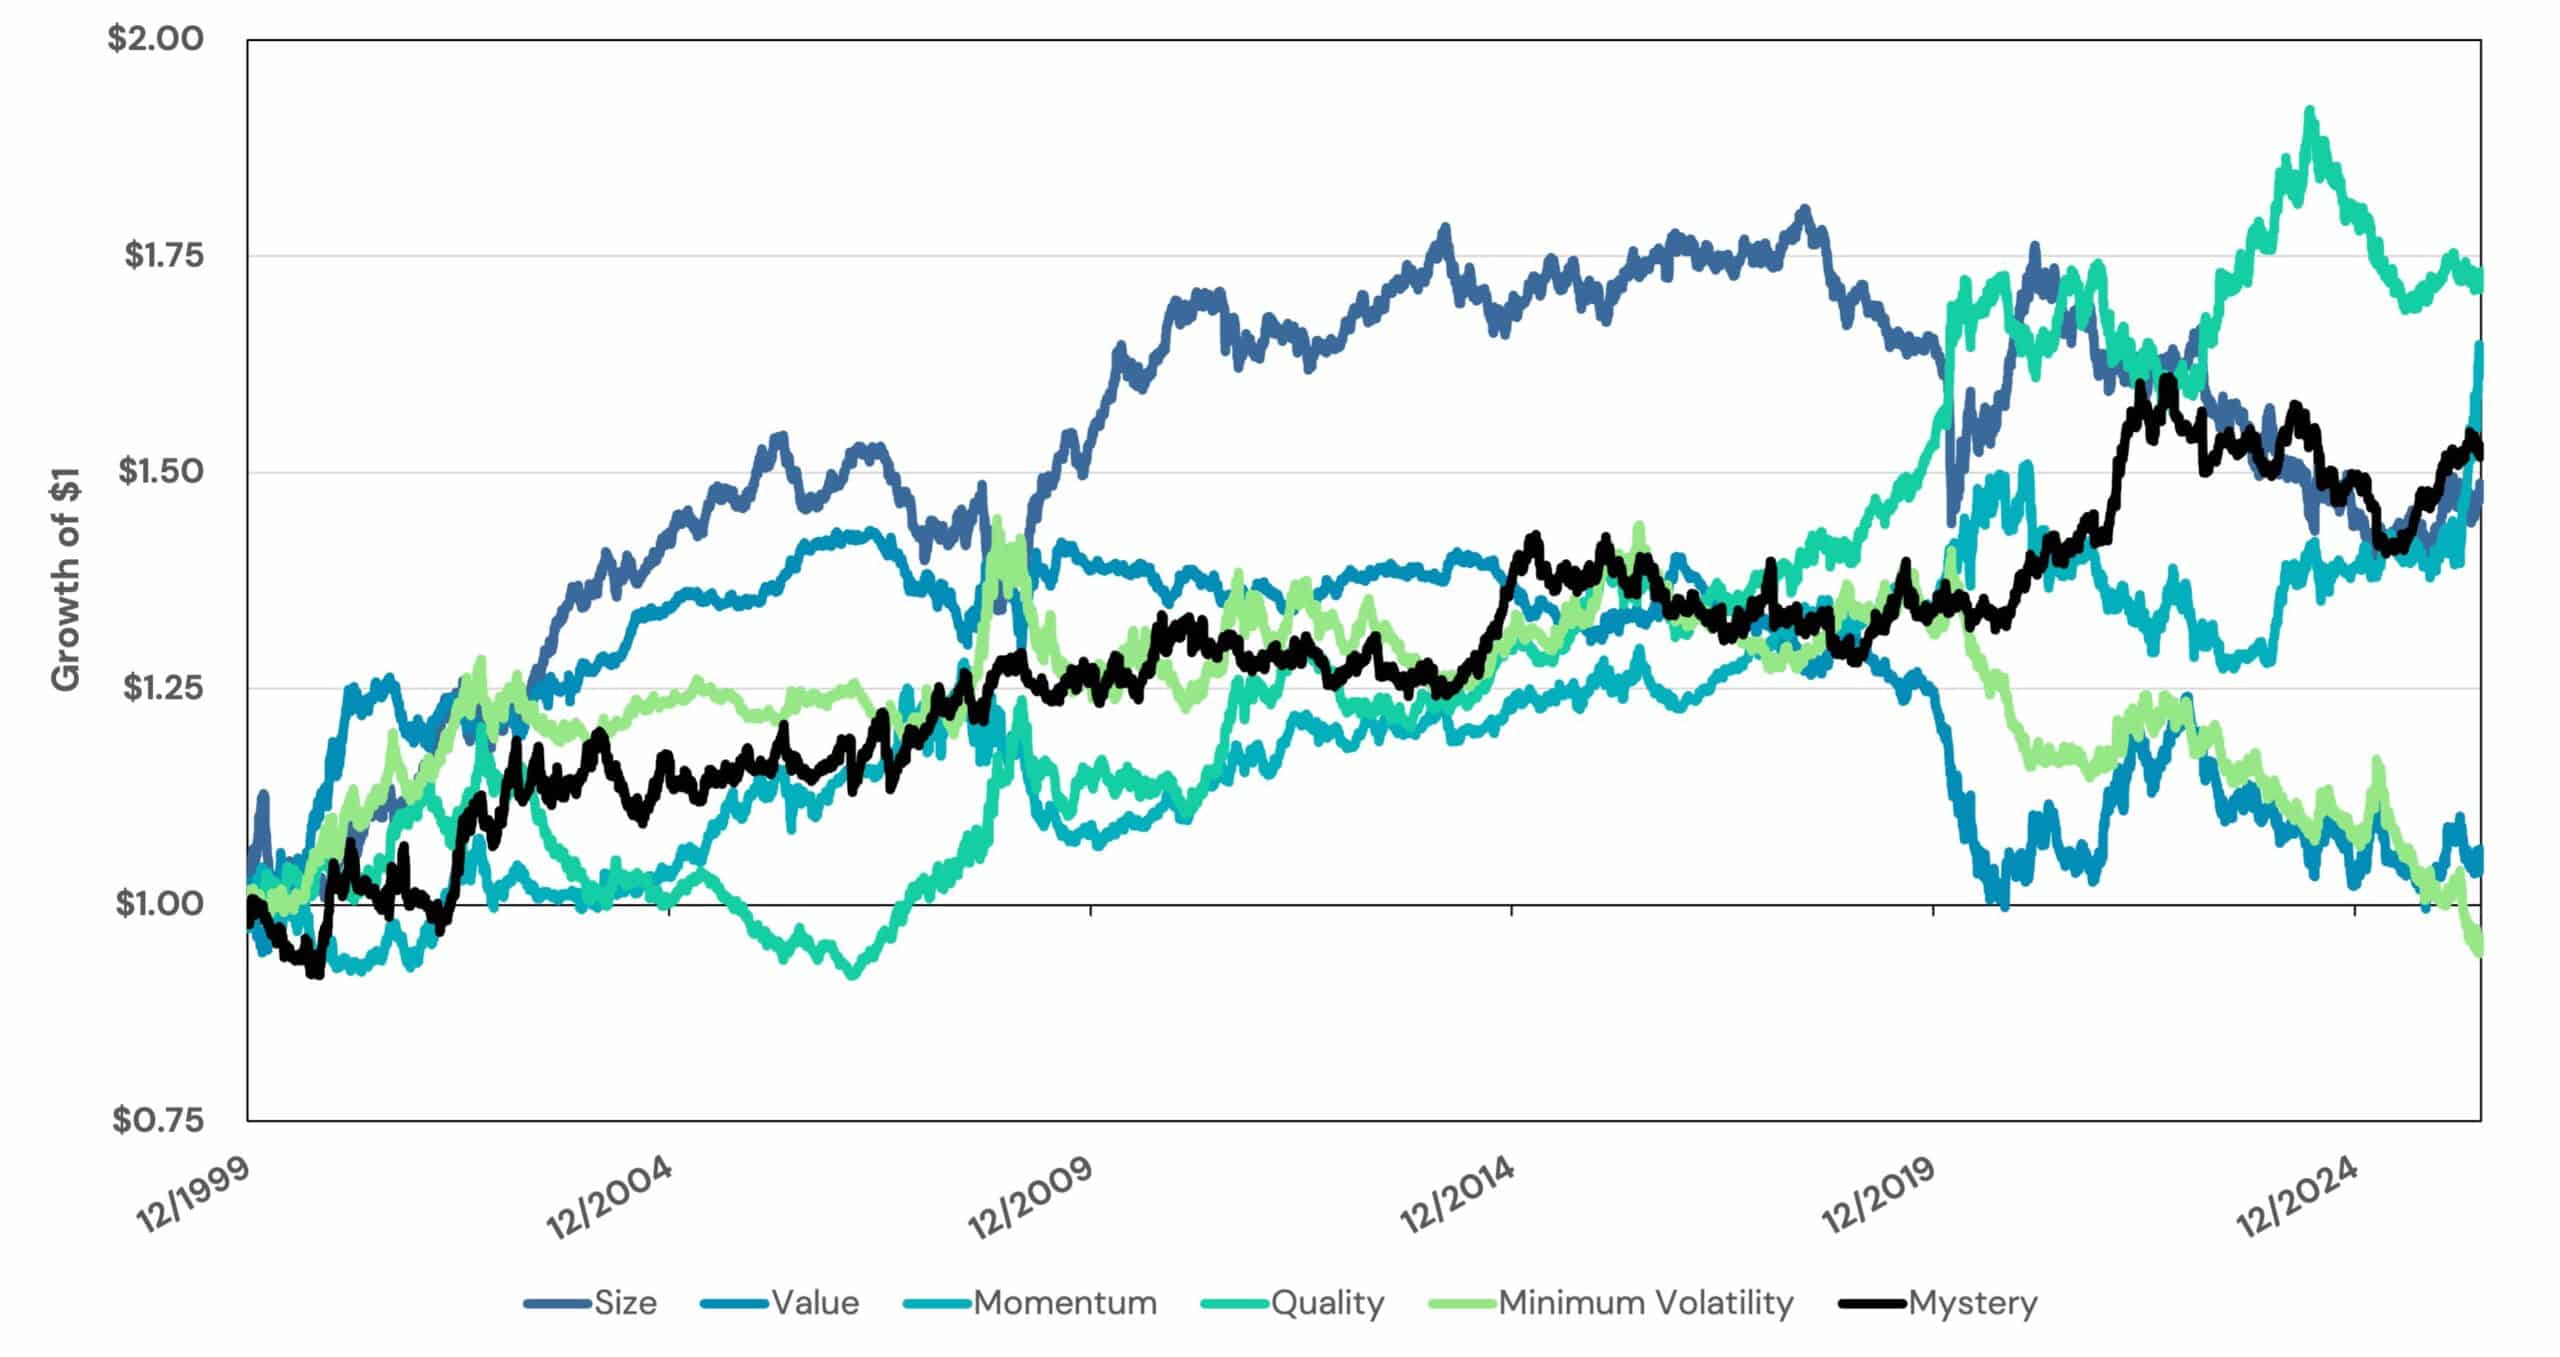
The mystery overlay holds its own with an information ratio of 0.32, ranking third of the six. The two factors ahead of it, quality and momentum, both did so while enduring deeper drawdowns. The mystery overlay’s drawdown is the shallowest of the group by a wide margin and its correlation to equities is effectively zero.
Regular readers of HedgeNordic may already suspect that the mystery overlay is not an equity factor at all, but a multi-asset trend following strategy. And they would be right: it is the SG Trend Index measured in excess of U.S. Treasury bills.
“Cheaters!” you may be tempted to shout.
That objection is fair. Trend following is not an equity factor. But when 93% of U.S.-domiciled global equity funds and 98% of Euro-denominated global equity funds failed to beat their benchmark after fees over the past decade, why would we keep hunting for alpha in the one place we already know it is hardest to find?
Return Stacking as a Third Lever
Both traditional levers reweight what the benchmark already holds, which means any active return they produce must be found among its constituents. Nothing requires alpha to be pursued that way.
Portable alpha (or return stacking, as we prefer to call it) separates two decisions: which beta to own and which alpha to pursue. Derivatives like futures and swaps make that separation practical because they only require margin rather than full funding. A manager can hold the trend exposure through futures and invest the capital not tied up as margin in global equity beta.
A fund that provides $1 of exposure to global equity and $1 of exposure to trend following for every $1 invested turns position size into a tracking error decision. If the trend strategy runs at roughly 13% volatility (in line with the SG Trend Index) an investor who replaces approximately 38% of their strategic global equity position in such a fund would introduce a 5% tracking error (ignoring interaction effects with any other active bets).
Exhibit 4 stacks each overlay with that same target 5% volatility on top of global equities.
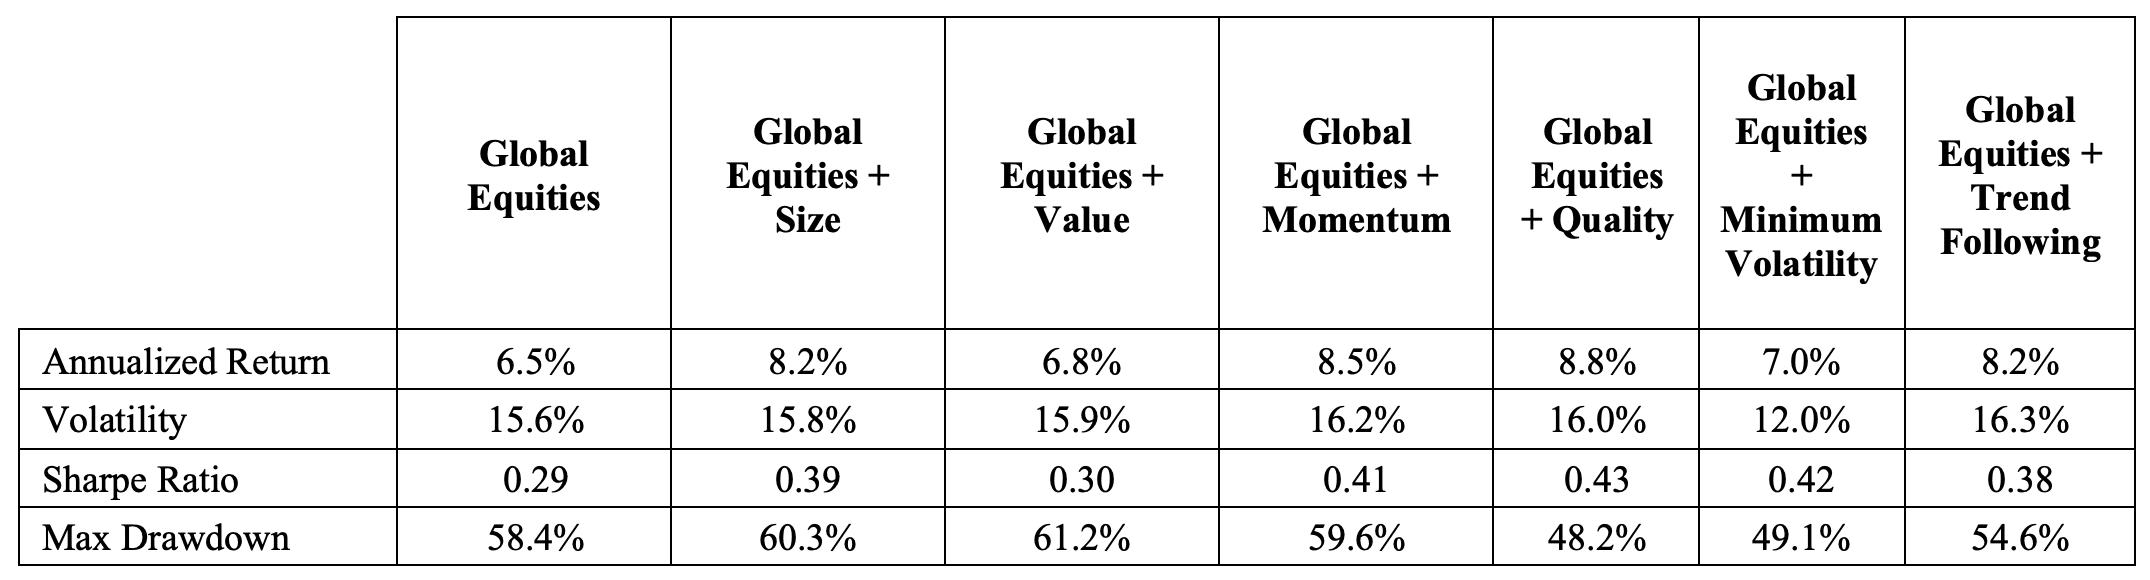
Every overlay improved on the benchmark’s 0.29 Sharpe ratio. The trend overlay would have lifted compound growth from 6.5% to 8.2% a year with a shallower worst drawdown than the benchmark, and none of it came from engaging in active stock selection.
By choosing the overlay explicitly, an investor can select those properties rather than inheriting them from whatever the constraints of long-only investing happen to produce.
Two ETF Designs That Deliver the Third Lever
Investors without direct access to futures and swaps could reasonably conclude that the third lever is beyond their reach. Innovations in the ETF space now mean it is not.
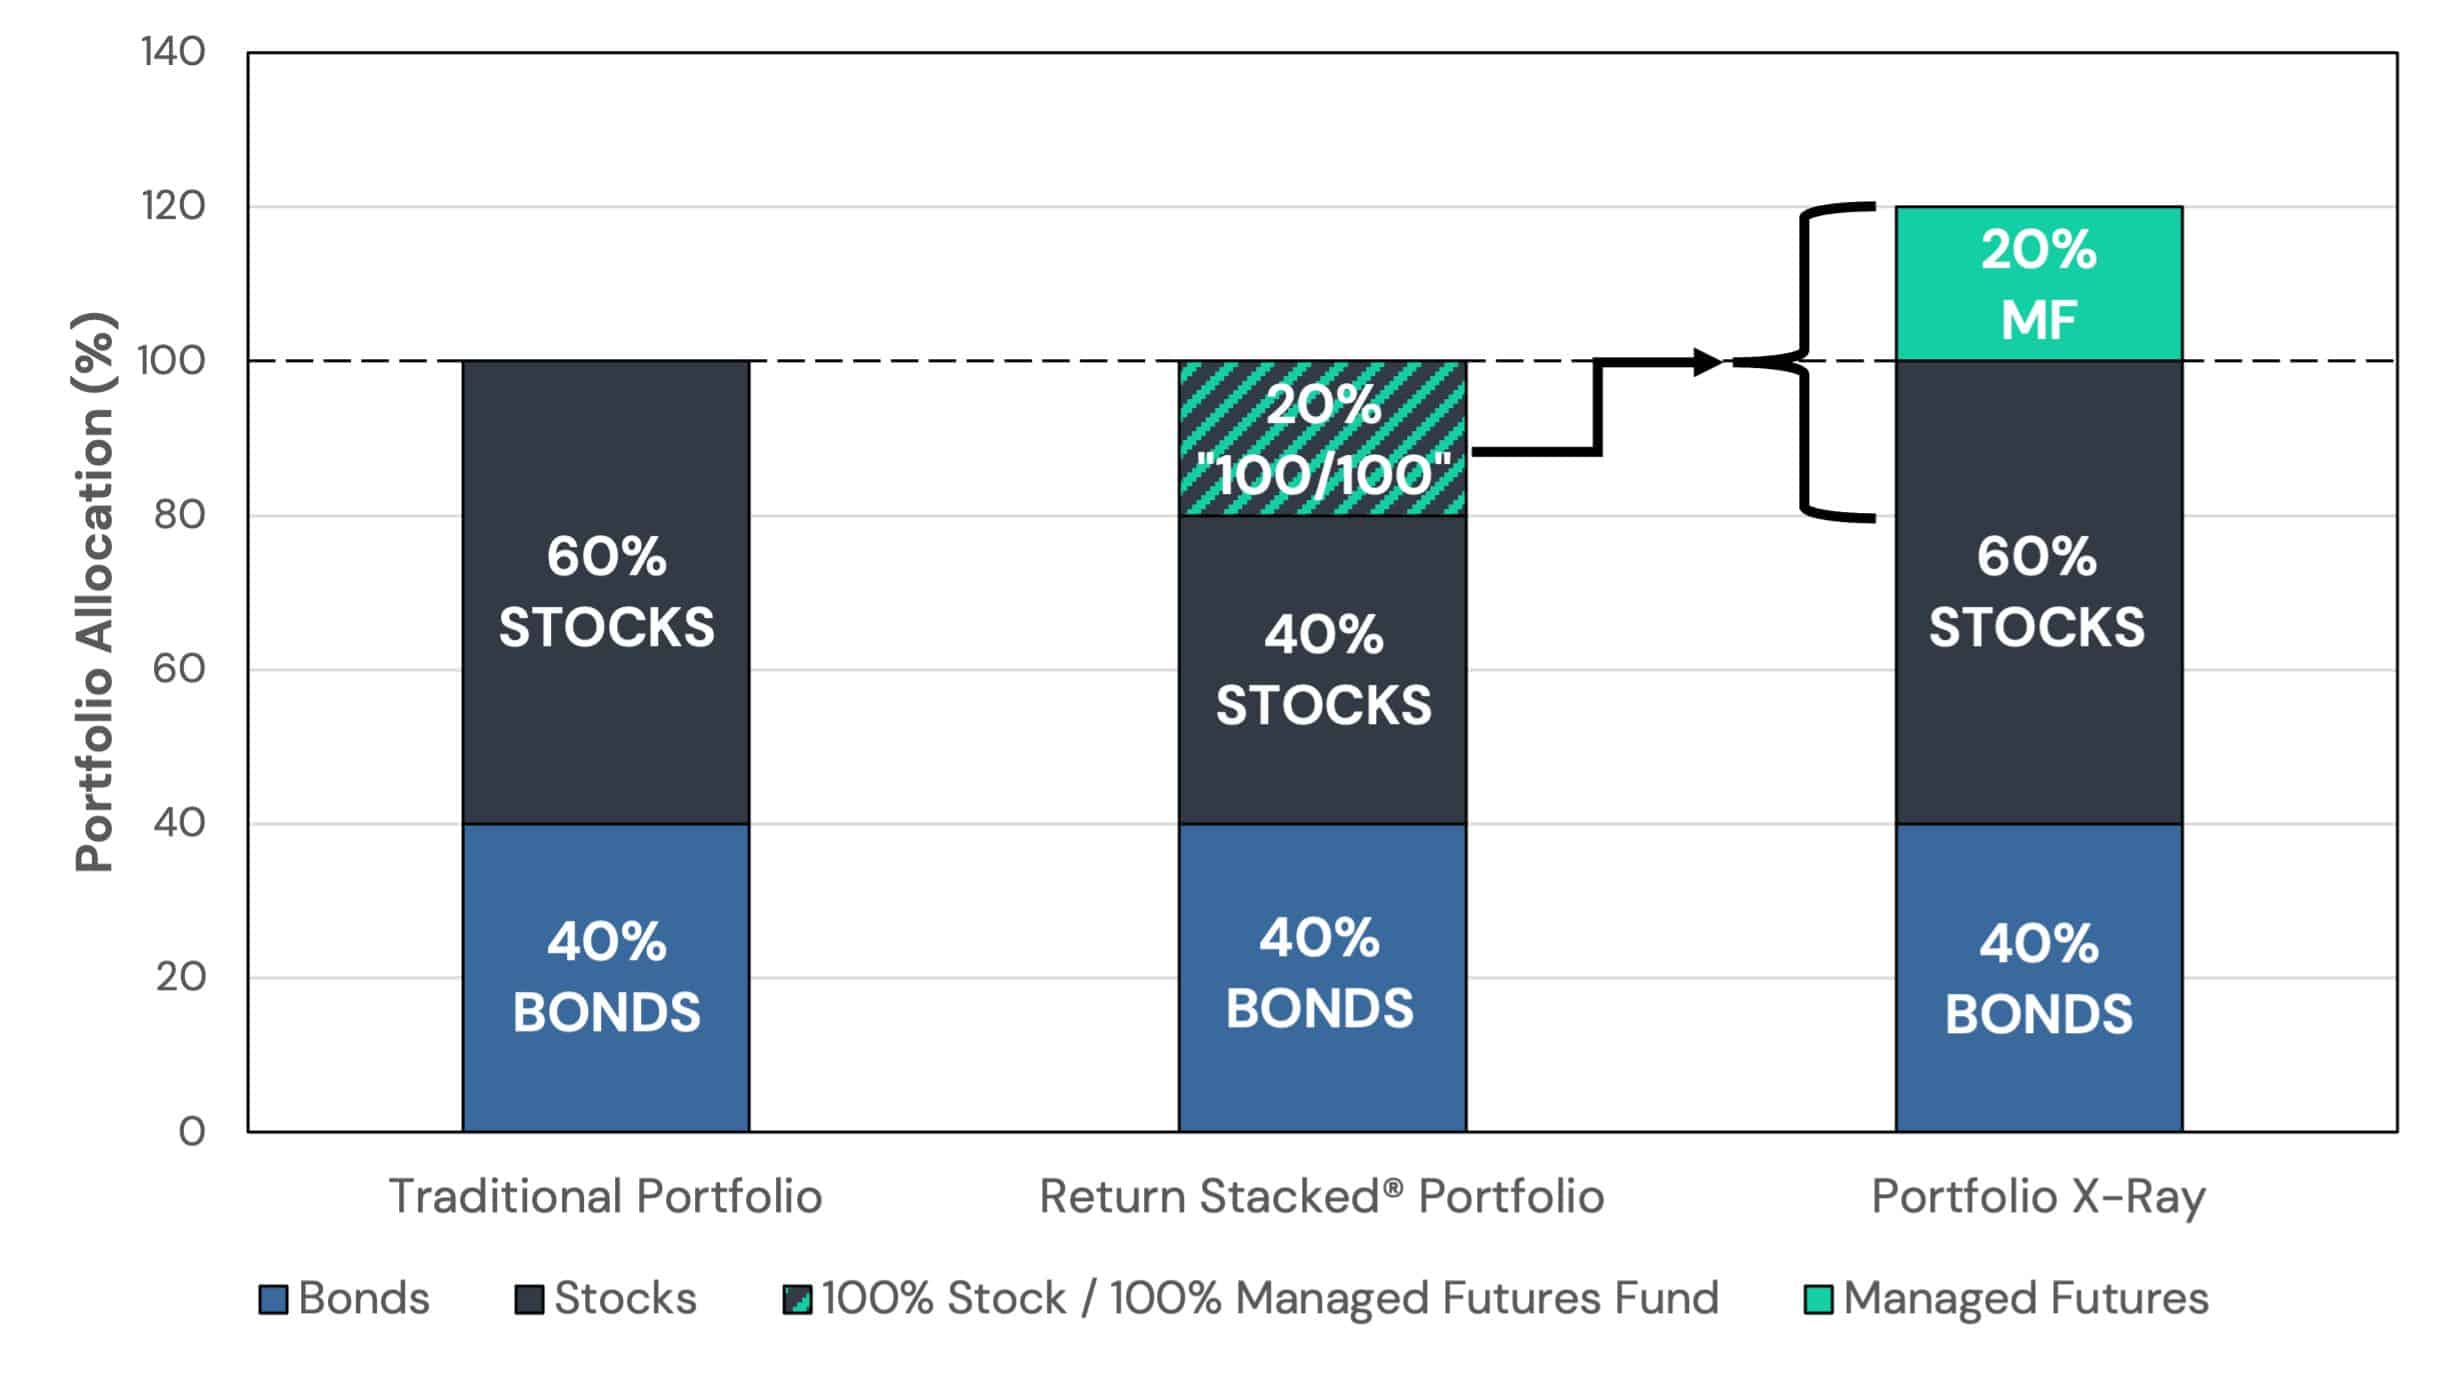
Consider two hypothetical ETFs. The first provides $1 of equity exposure and $1 of managed futures trend following exposure for every $1 invested. Swapping 20 points of equity in a 60/40 portfolio into such a fund holds equity exposure constant while adding a 20% trend following overlay, with roughly 2.6% tracking error.
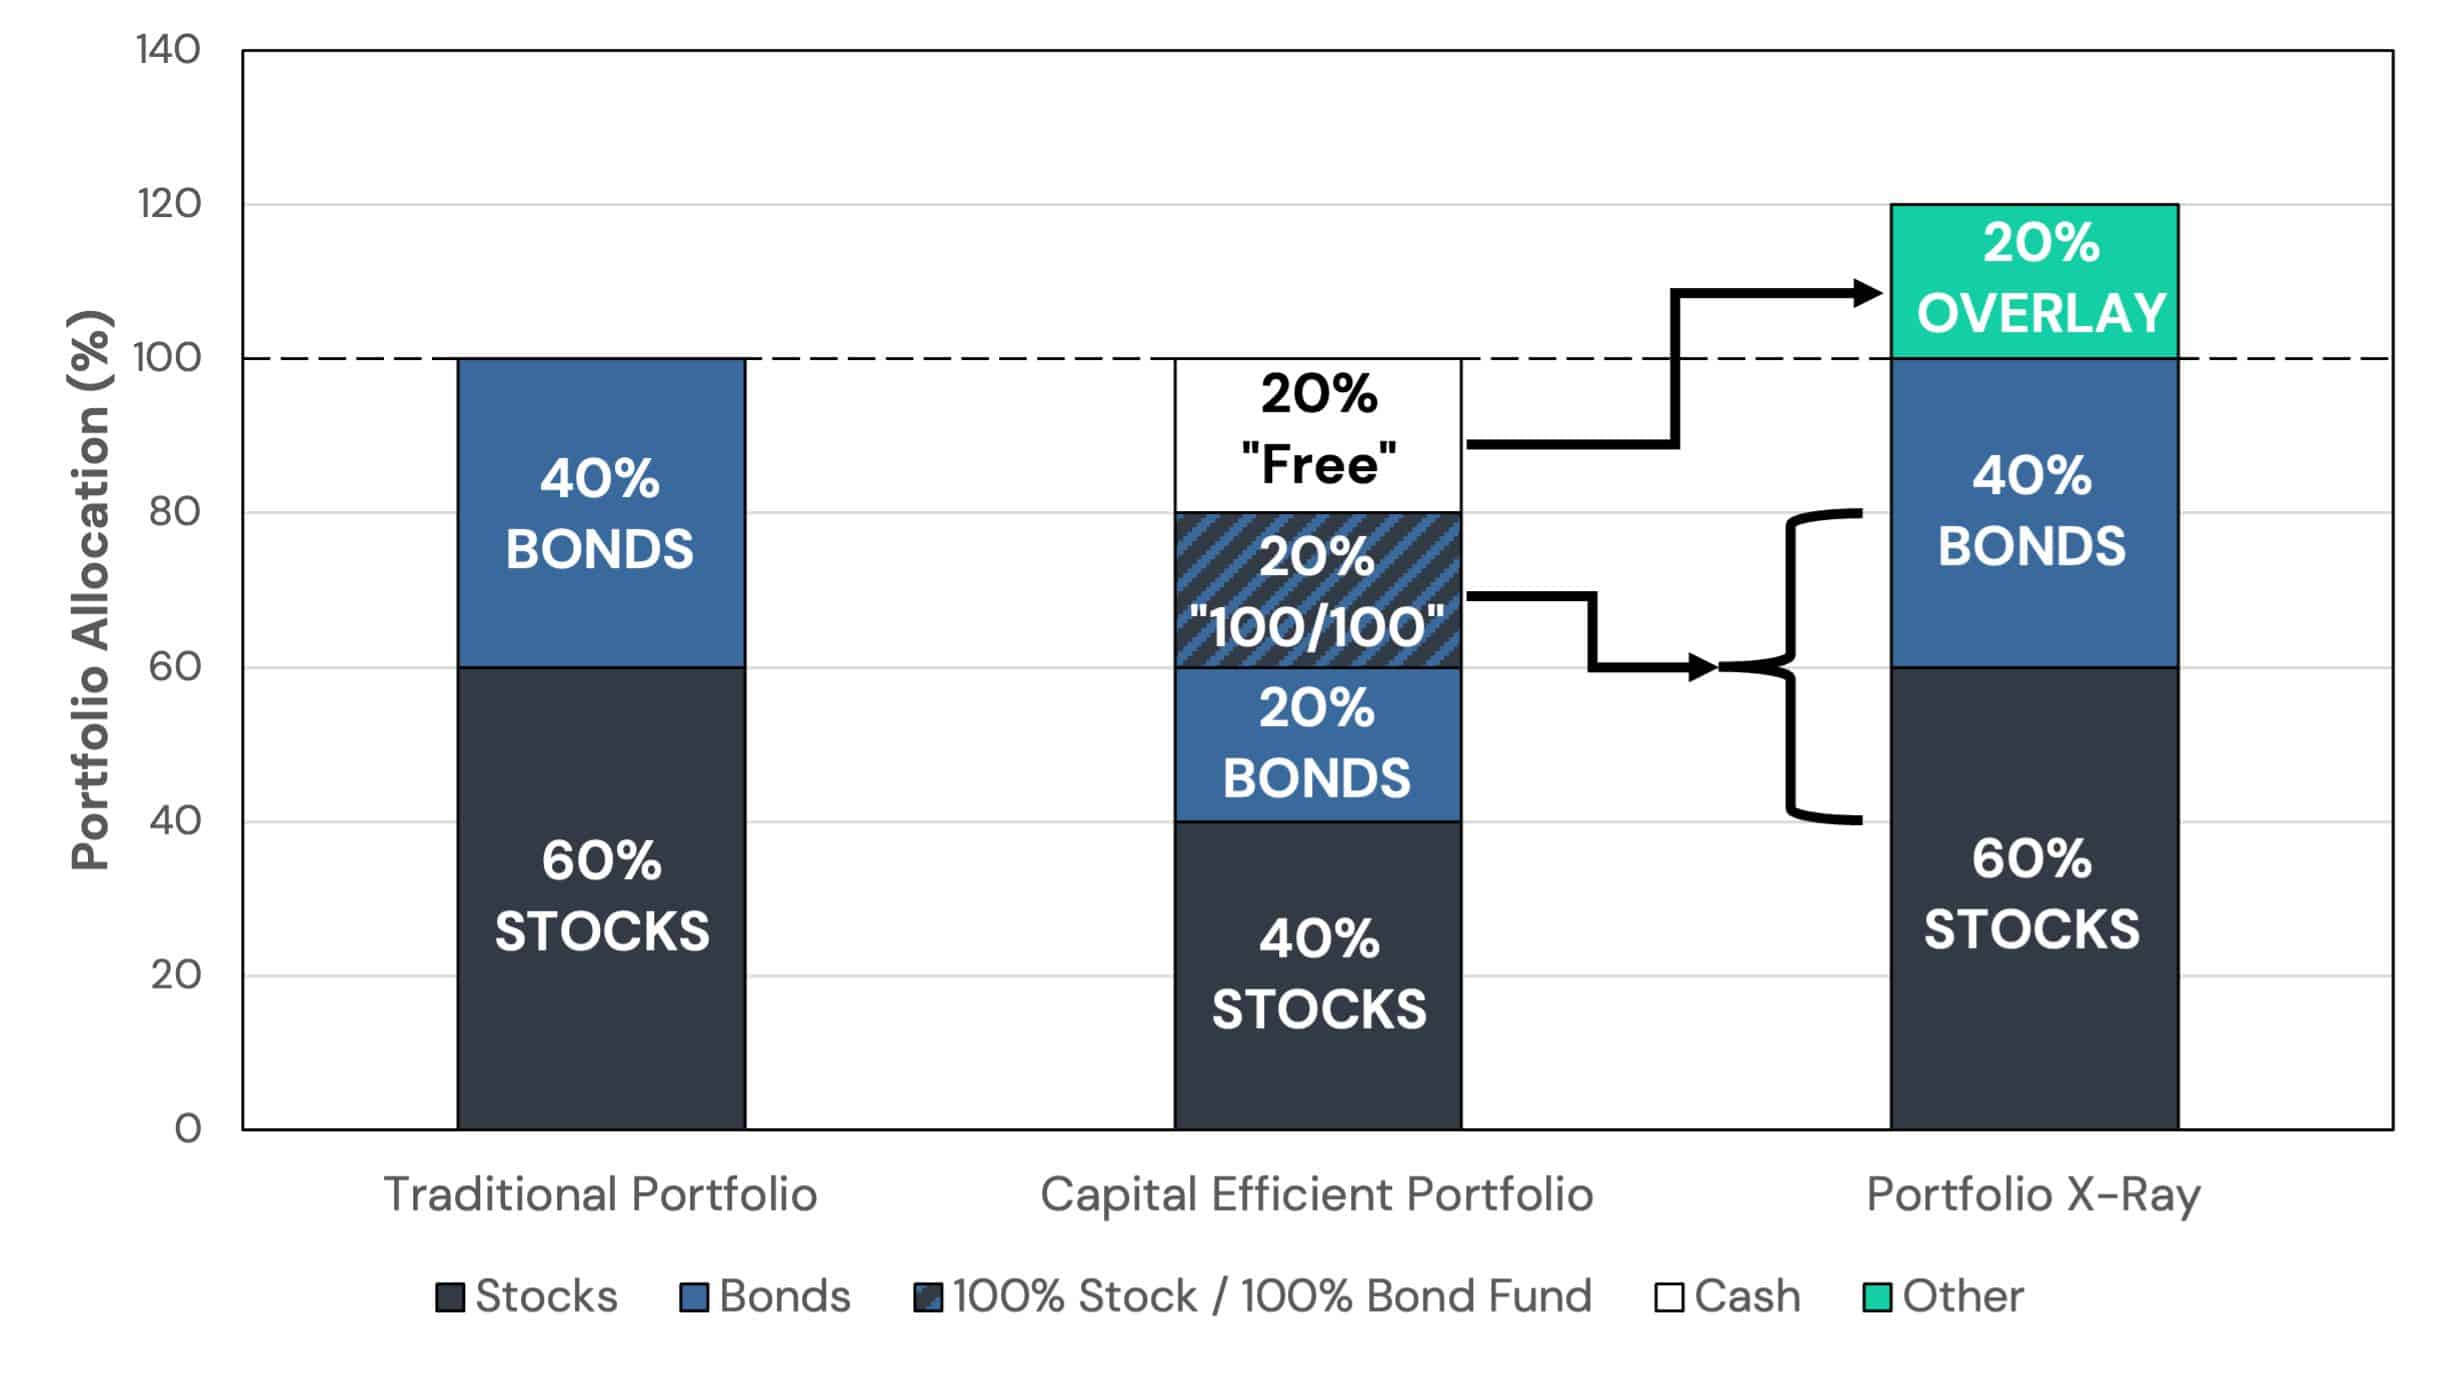
The second provides $1 of equity exposure alongside $1 of bond exposure for every $1 invested. Given the same 60/40 stock and bond policy portfolio, a 20% position in such a fund replaces 20% exposure each of equities and bonds, leaving 20 points of capital free for other diversifiers or alpha strategies. How that freed-up capital is deployed is left to the investor.
Making Active Bets Explicit
Traditional long-only active managers would not describe themselves as running a long/short overlay, yet mechanically that is what they do. For most of active management’s history, that overlay was constrained by the benchmark it was built from.
Return stacking turns the implicit into the explicit. The question then stops being which manager to hire and becomes which overlay to own.
Glossary
Global Equities – The MSCI ACWI Net Return Index (NDUEACWF Index)
Treasury Bills – The Bloomberg US Treasury Bills 1-3 Month Index (LD12TRUU Index).
Value – The MSCI ACWI Value Net Return Index (MXWD000V Index). Excess returns are measured against Global Equities
Size – The MSCI ACWI Small-Cap Net Return Index (M1WDSC Index). Excess returns are measured against Global Equities
Momentum – The MSCI ACWI Momentum Net Return Index (M1WD000$ Index). Excess returns are measured against Global Equities
Quality – The MSCI ACWI Quality Net Return Index (M1WDQU Index). Excess returns are measured against Global Equities.
Minimum Volatility – The MSCI ACWI Min Vol Net Return Index (M00IWD$O Index). Excess returns are measured against Global Equities.
Mystery / Managed Futures Trend Following – The SG Trend Index (NEIXCTAT). Excess returns are measured against Treasury Bills.
Important Information
This material is for informational and educational purposes only and is intended for use by investment professionals. It is not intended as investment advice or as a recommendation to buy or sell any security or to adopt any investment strategy. The views expressed are those of the authors as of the date of publication and are subject to change without notice.
Return stacking may involve the use of derivatives, leverage, and short selling, each of which may increase potential losses and risk.
