By Linus Nilsson and Tanya Gupta, NilssonHedge – Benchmarking a CTA (or any active strategy) is sometimes easy, but occasionally a difficult exercise. On the surface, it is about comparing a particular manager with other opportunities, an index, or absolute return expectations. But which one? What adjustments to make?
CTAs, in particular, have widely different risk levels which can cause low volatility managers to appear uncompetitive and higher volatility strategies may be perceived as overly risky. Most investment professionals adjust for volatility, either by looking at risk-adjusted rations (e.g. the Sharpe ratio) or by adjusting the time series itself.
Sadly, standalone result is never quite enough to convince investors. It is all relative, and no one has the same frame of reference, neither in time nor space. In this article, we present a few options from the viewpoint of a practitioner, that may be useful for both allocators and managers. This is not in any shape or form a universal solution, but rather a step in what we believe to be the right direction.
Index Benchmarking
A standardized approach is to use one of the many existing Hedge Fund benchmarks available to investors. Hedge fund indices generally suffer from backfill biases, survivorship and a myriad of other effect. As a general remark we would urge the analysts to use indices where these issues have been reduced as much as possible. Transparency is important, index formation and disclosed constituents are of importance for credibility.
If you outperform the benchmark, all is well, nothing more to worry about. Not that easy. You have more ground to cover, especially so when dealing with sophisticated clients.
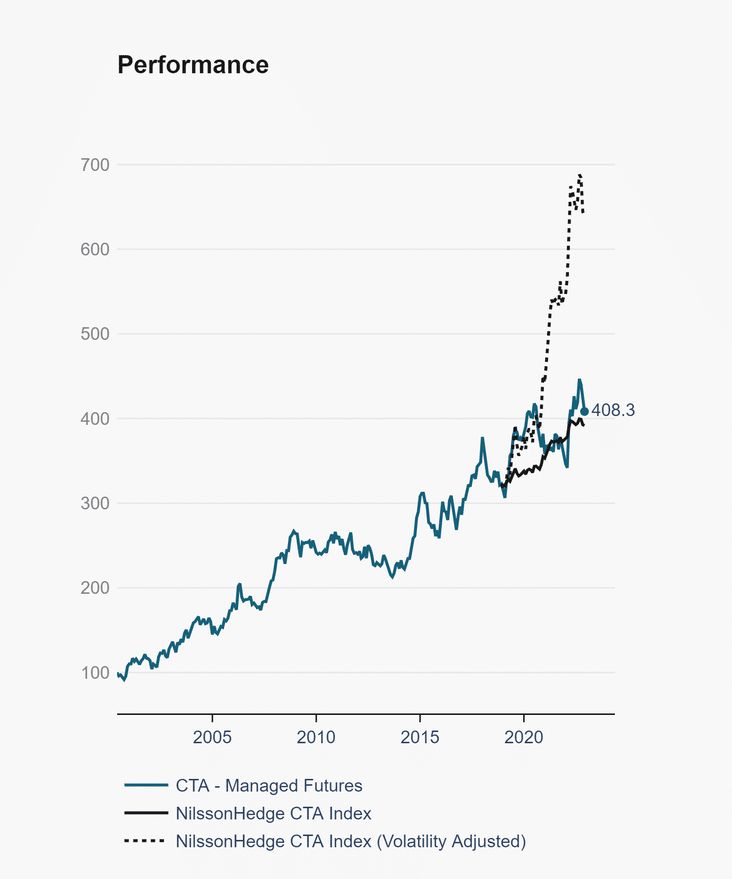
For CTAs, given the potential for notional funding, there is a range of risk levels that is largely decided by the manager and clients. Thus, you probably want to volatility adjust the benchmark or the return stream from the manager. The simpler approach of looking at volatility adjusted ratios may miss specific events (for instance if all the out or under performance occurs in one month).
Throughout the post-Covid period, inflation has reared its ugly head and the world left the zero-interest rate policy regime. As most CTAs earn interest on their cash holdings you want to adjust for the prevailing funding rate. You can use the below “algorithm” to arrive at volatility adjusted returns:
- Calculate excess returns, by removing the interest rate earnings. For simplicity you can use the prevailing US T-Bill rate.
- Rescale the volatility of the excess returns to the target volatility level by multiplying by the ratio of the standard deviations of the investment and the benchmark. Other risk measures can be used.
- Finally, add back the interest rate and you have now created a return stream that can be compared to the index.
- Simply adjusting for the volatility ratio has been mostly correct for the past decade. If higher interest rates persist the precision of the scaling will deteriorate.
In this manner, you have created a fair representation for a Managed Futures program, where the interest rate earning may be a significant component. The immediate drawback here, is that this an ex-post adjustment. But you are likely to only have access to “after the fact” information, so the problem is somewhat hard to circumvent.
We observe that not all CTAs treat interest rate earnings in a consistent manner. Preferably you want returns from a fund or a fully funded account rather than a composite. A composite may be compiled based on accounts with different funding levels which may cause different interest rate earnings than expected. This is generally a second order effect and for most exercises an approximation is correct.
That’s the easy way of benchmarking. Here we note that an index almost always has the benefit of having exposure to diversified strategies and managers need to compensate for the diversification benefit with higher quality returns.
Factors
In prior articles, we have done some work explaining how factors can be used to dynamically extract the alpha profile of a particular manager. There are several different approaches that can be used, and for most Hedge Funds a risk premia / factor exposure library is highly recommended. This will help you to understand implicit exposure to known strategies and how much residual alpha that is generated.
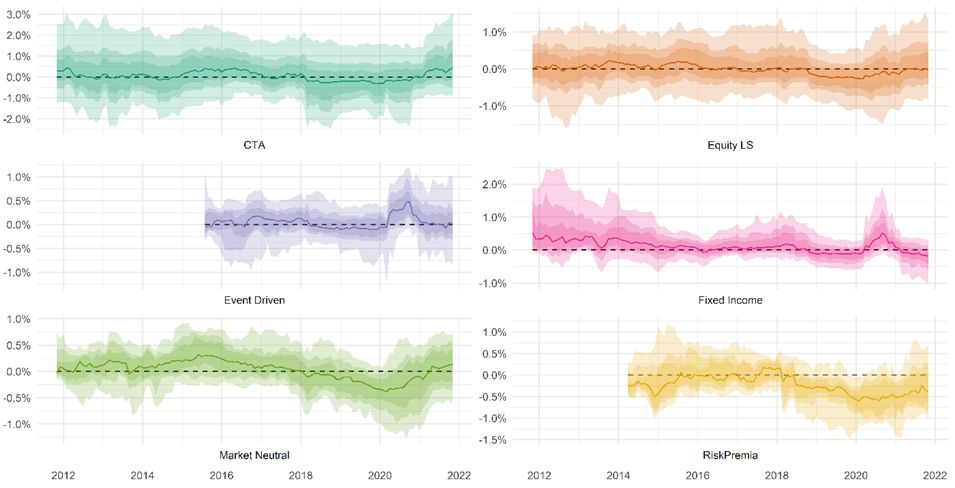
In an academic setting, the Fama-French factors are commonly used. For Trend Following, various types of momentum rules can form the basis for a factor library.
The factor loadings and the “residual” alpha can be calculated using various regression techniques. We have described a method in previous articles. Alpha is not necessarily the same as better returns than peers but may yield interesting findings.
Peer Groups
Dispersion measures the range of outcomes. Typically, we are interested in the median, upper and lower quartile performance, or any other measure of reasonable variability.
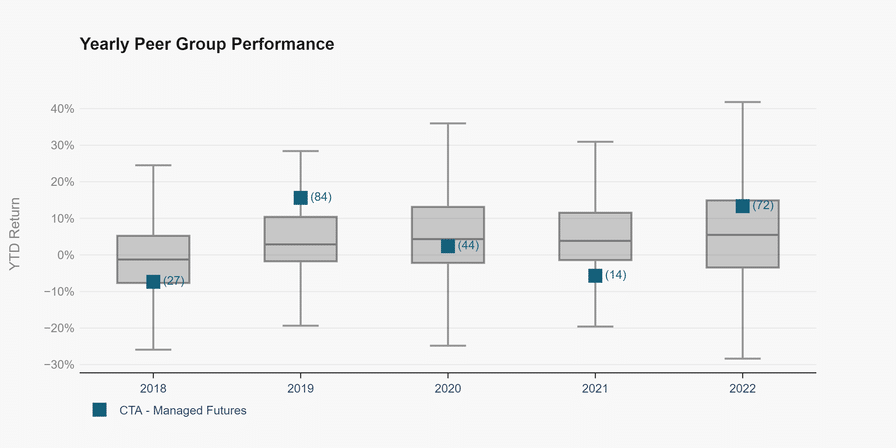
Box plots is one of the more classical ways to illustrate dispersion relative to peers. It gives a quick impression of the performance compared to competitors but is usually only applied to a specific time period. In the chart, we look at annualized performance.
In the example above, we observe the large variability in relative ranking, indicating that the manager may offer some diversification benefits.
Our approach to benchmarking is to generalize the boxplot and take the analysis a step further, by combining cumulative boundaries for the complete peer group’s performance and compare to the result of an investment opportunity. This gives the user an easy to interpret analysis of when a manager is doing better than peers, and when they are doing worse.
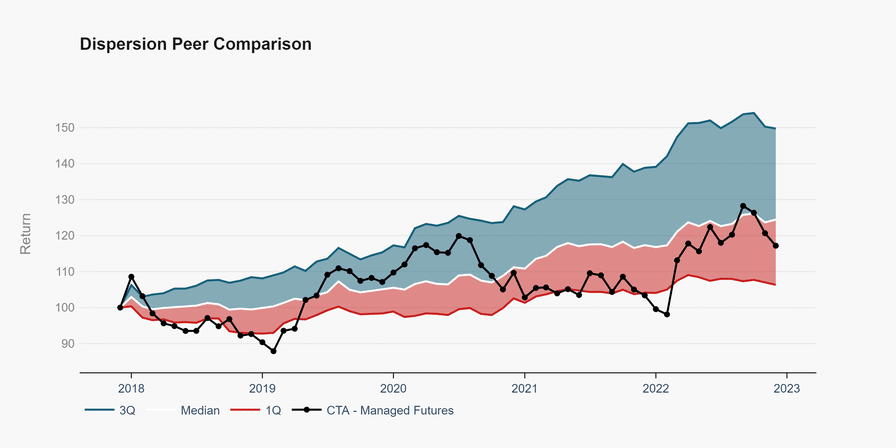
In the chart below, we can clearly see when manager is performing below expectations, compared to a universe of peers (here 705 CTAs). In this example, we have a manager that is struggling to be persistently above the median. We are convinced that this gives more information compared to performance cones (i.e. expected returns compared against standard deviation boundaries), boxplots or compared to a hedge fund index.
It allows you to focus your analysis on why and when you are expected do better and likewise explain in which environments you have underperformed.
In summary, there are multiple ways of analyzing performance, but it can rarely be analyzed on a stand-alone basis or using one method. The more data you have access to, the better you can judge the potential opportunity set. Your performance is always relative.
 Linus Nilsson is the founder of NilssonHedge. He has served as the CIO and partner for a hedge fund, founded an emerging hedge fund, and worked as a hedge fund analyst for several international investors, and as a risk specialist for a major bank.
He founded NilssonHedge, a database with a focus on CTAs and other Liquid Alternatives. Nilsson has lived in six different countries and has published articles in industry journals and appeared as a speaker and moderator at industry conferences. In academic terms, he holds two master’s degrees from the Chalmers University of Technology and Gothenburg University.

Tanya Gupta is a quant analyst at NilssonHedge and a quantitative finance graduate student at Erasmus University. An investments and technology enthusiast, she also developed and maintains research radars on green bonds and natural language processing in finance.