By Jonathan Barry and Indhu Raghavan of MFS Investment Management:
Executive summary
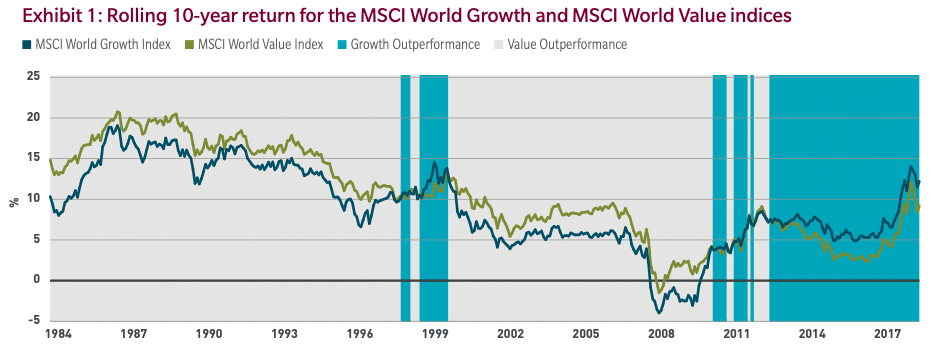
- With growth indices generally outperforming value indices over the past 10 years (see Exhibit 1), some asset owners may be questioning the prospects for value investing going forward.
- We view style-based investing as a portfolio construction and implementation consideration rather than a strategic asset allocation issue.
- In the long term, we believe a balanced exposure to both styles leads to a better diversified portfolio both because style leadership rotates for a variety of reasons and style rotation is difficult to time and because skilled active management has generated excess return in both the growth and value styles (see Exhibit 5).¹
MFS has substantial experience in managing both growth and value style portfolios, and we sometimes field questions around their relative performance and the merits of style-based investing. With value strategies having underperformed growth strategies over the past 10 years, we believe some asset owners may be asking the following:
- Is it time to reallocate the value allocation?
- Is it possible to time styles and factors, or should one tilt toward one or the other style or factor over time?
- Are active managers able to generate excess returns in the value space?
This paper takes a long-term view in illustrating the relative risk/return profiles, and sector and factor exposures that growth and value style strategies can bring to the overall equity allocation.
Style decision within the investment process
The concept of investment style, such as growth and value, has been used to understand the characteristics of individual stocks, to describe a manager’s approach to analyzing securities and to build benchmarks.
Where does the decision on style fit within the overall investment process? At the highest level is the strategic asset allocation and the balance of equities, fixed income and alternative investments and within the equity component, the split between domestic equity and non-domestic equity.²
Once the strategic asset allocation is set, portfolio construction comes into play, which may involve decisions around size, such as large cap and small cap, and style, such as growth and value strategies. The final step of the process is implementation, which involves deciding whether to access the strategies on an active or passive basis, and within active investing, decisions around the approach a manager is taking to try to generate excess returns, such as fundamental research or quantitative.
Long-term performance of style-based portfolios
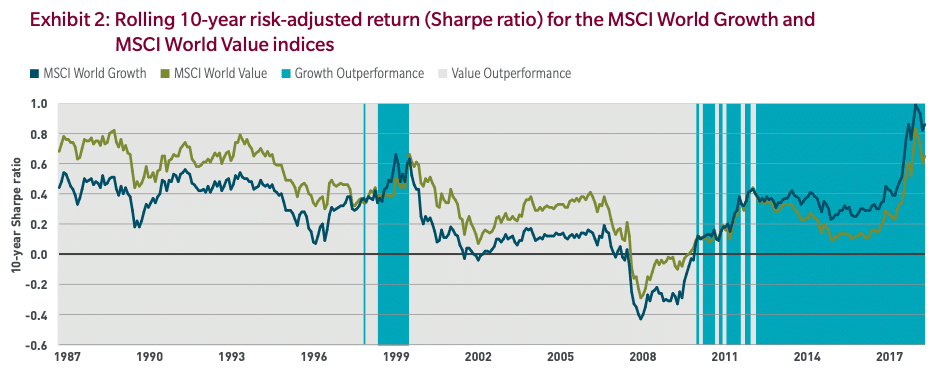
Over the past 10 years, value style indices and portfolios have generally lagged the overall market as represented by the MSCI World index, and their growth counterparts. However, it is worth looking at these indices through a long-term lens. Exhibits 1 and 2 show the 10-year rolling returns and the 10-year rolling risk-adjusted returns (Sharpe ratio) for the MSCI World Growth and MSCI World Value indices, highlighting periods in which the growth index has outperformed the value index and vice versa.
As can be seen in Exhibits 1 and 2, style leadership has varied over time. Even though the most recent 10-year period has seen growth generally outperforming value, there have been long periods during which value has outperformed growth on both an absolute and risk-adjusted basis, such as between 2000 and 2010. In part, this leadership rotation is due to idiosyncratic sector-specific issues that affect the indices differently. For example, during the global financial crisis of 2008-2009, the financial sector experienced significant losses that contributed to the value index’s relative underperformance in the 10-year rolling periods that include that time period due to its greater exposure to the financial sector, while during the tech crash in the early 2000s, the technology sector experienced significant losses that contributed to the growth index’s underperformance. Such sector-specific issues make it difficult to predict leadership going forward.
Varying exposures of growth and value styles
As noted above, some of the reasons for varying historical performance come from differing exposures to sectors. In addition, growth and value styles also offer different factor exposures, which can drive performance during various market environments.
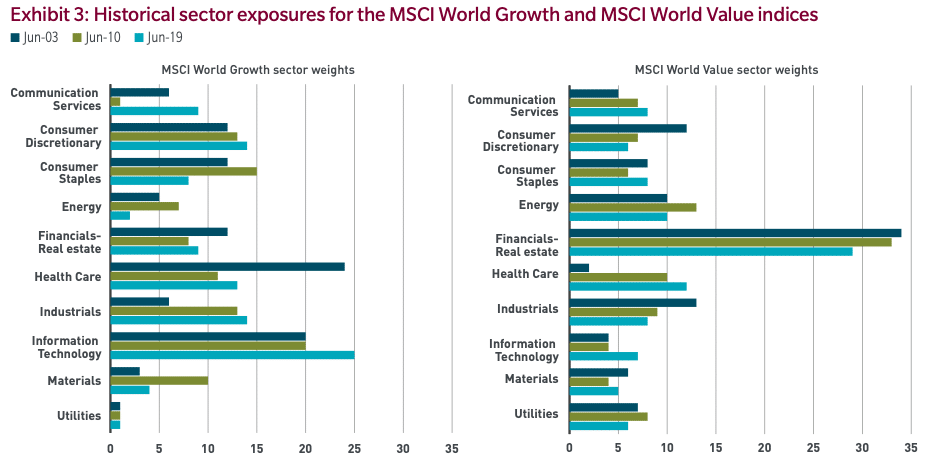
Exhibit 3 shows how sector exposures have evolved over time for the MSCI World Growth and MSCI World Value indices. In general, the value index has offered higher exposure to the financial, energy and utilities sectors while the growth index has offered higher exposure to the consumer discretionary, industrials and information technology sectors. Sector exposures evolve along with structural changes within industries as well as the macroeconomic and market environments. For example, over the past 10 years the growth of platform-based technology companies that benefitted from scale has given rise to mega-cap companies that boost the sector weights for information technology. Conversely, valuations for banks have compressed, despite their being better capitalized than before the global financial crisis of 2008-09, and providing decent returns on capital.
Moving beyond sectors, we consider key factor exposures that can affect risk and return over time using the MSCI Factor Classification Standard framework, which places each of 16 factors in one of eight factor groups. Exhibit 4 shows the various factor exposures for the MSCI World Growth and MSCI World Value indices.
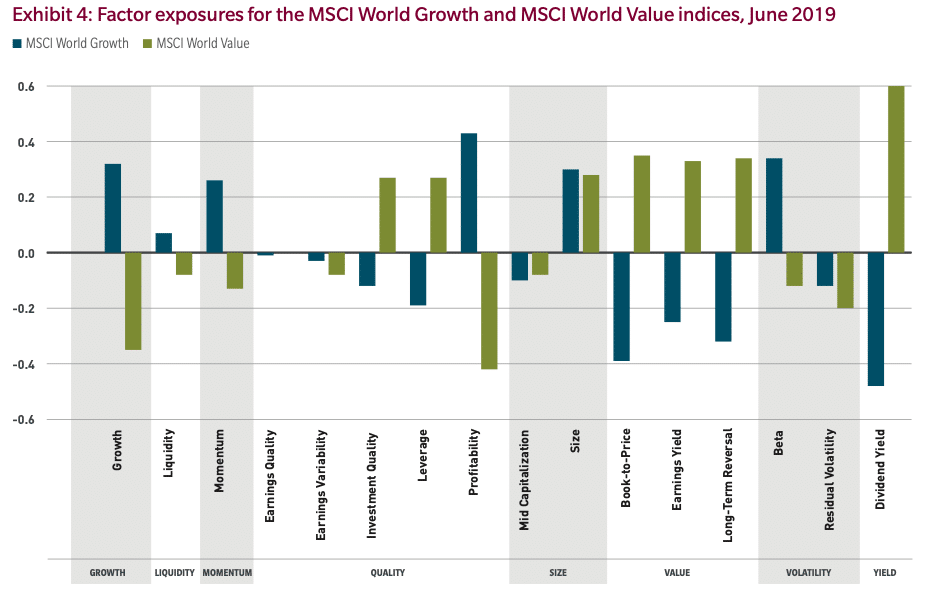
The factor exposures shown here indicate the sensitivity of the index to a given factor as compared to the world investable equity universe as measured in standard deviations. For example, the constituents of the MSCI World Value Index in aggregate have a book-to-price ratio that is approximately 0.4 standard deviations higher than the median book-to-price ratio for the world investable equity universe while the constituents of the MSCI World Growth Index in aggregate have a book-to-price ratio that is about 0.4 standard deviations lower than the median book-to-price ratio for the world investible equity universe.
Not surprisingly, the MSCI World Value Index has higher exposure to value-related factors such as book-to-price and dividend yield than the MSCI World Growth Index. The opposite is true for the MSCI World Growth Index, which exhibits higher exposure to momentum and growth factors. The two indices have mixed exposure to quality factors. Finally, the MSCI World Growth Index exhibits higher exposure to the volatility factor (beta) than the MSCI World Value Index.
This analysis suggests that some balance between growth and value styles may be prudent given the varying exposures to these key factors. For example, a portfolio that aims to maximize exposure to quality factors could find opportunities in both the growth and value universe of stocks. Conversely, both growth and value portfolios can provide exposure to quality factors.³
Analysis of active management in growth and value styles
Assuming an investor wants to pursue a style-based equity portfolio, a key question to consider as we move down the chain in the investment decision-making process is whether to access a growth or value strategy through an active or a passive approach.
To do this, we looked at the rolling 10-year active manager performance by style measured as excess return over the MSCI World Index, as shown in Exhibit 5.
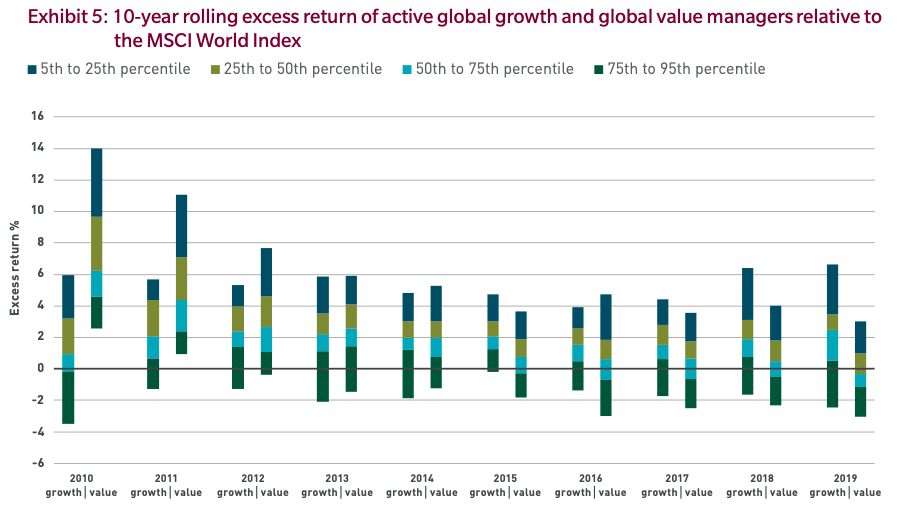
Here we note that in the most recent rolling 10-year period (the period from 1 April 2009 to 31 March 2019) most active growth managers outperformed the index on a gross basis and in this same period top-quartile growth managers outperformed top-quartile value managers by approximately 250 basis points. We can also see that the range of outcomes for active growth and value managers is similar for the 10-year periods ending 2013 through 2017, with active growth managers demonstrating slightly better performance than value managers overall.
Finally, we observe that active value managers demonstrated significantly better results for the 10-year periods ending 2010 and 2011 with top quartile value managers outperforming their growth counterparts by approximately 650 and 275 basis points in those periods, respectively. It is worth noting that the 10-year periods ending 2010 and 2011 incorporate both the Global Financial Crisis as well as the Tech Crash of the early 2000s, which suggests that active value managers have historically had some advantage over active growth managers when considered across multiple down markets.
Conclusion
Over the long run, there have been periods of outperformance for both the value style and the growth style, and there is little evidence to demonstrate the ability to accurately time shifts in styles or factors. That said, it may be reasonable to develop frameworks that systematically rebalance or tilt portfolios based on relative relationships and/or fundamentals compared to a strategic target allocation. Importantly, although past performance is no guarantee of future results, for the time periods shown we do see that skilled active managers have been able to generate excess returns in both the growth and value styles. Thus, we believe a balanced long-term exposure to both styles could lead to a better diversified equity portfolio.
Endnotes
- 1. We believe skilled active managers are those who can demonstrate conviction through high active share and long holding periods, add value in volatile markets and collaborate on investment decision making.
- 2. Alternative investments may include private equity, private debt, unlisted real estate, infrastructure, etc.
- 3. It is important to note that in this analysis factor exposures are the result of an index or equity portfolio construction process, which depends on the index provider’s methodology or the portfolio manager’s approach (e.g., fundamental or quantitative), respectively.
The Authors:

This article featured in HedgeNordic’s Special Report on Equity Strategies.
Image by By-niroworld—shutterstock.com