Lower no Longer: Cash & Carry in the Emissions Markets
By Adam Golden, Dr. Moritz Heiden, Felix Hofer – Munich Re Investment Partners: Over the last 5 years investors seeking secure, shorter-dated euro-denominated returns have not had many good options. For example, 12-month Bubills have on average yielded a negative 63bps p.a. since September 2016 as flight-to-safety dynamics have resulted in strong demand for government bonds. However, in our opinion, better risk/reward profiles can be found without taking on excessive risks.
At -63bps one would be better off burying any excess euro cash in the backyard, as long as one is confident that the odds are longer than 159 to 1 that someone would find it, dig it up, and take it. At Munich Re Investment Partners, a systematic, climate-driven investment manager, we decided to investigate deploying an age-old commodities strategy into one of the hottest and fastest growing financial markets globally, EUA Emissions Allowances, in order to improve euro cash returns.


2 – Cash & Carry in the Emissions Markets
Cash & Carry is not a new strategy to the commodities markets. The essential components of this trade are to use the cash to buy the underlying commodity while simultaneously agreeing to sell it at a future point in time, e.g., via a futures contract. The futures contract will converge with the physical underlying at maturity, allowing the trader to unwind both legs of the spread and capture the difference, known as the implied yield. Cash & Carry returns derive from several factors, among others: the amount of funding available to the market, storage costs, insurance, and the ability to take physical delivery. Prominent examples of Cash & Carry trades can be found in diverse markets such as crude oil, where physical cargo is loaded on a tanker and held off-shore to take advantage of the contango in the forward curve, or in the treasury bond market, where significant leverage is deployed on cheapest-to-deliver bonds which will converge with their futures contract equivalent. The nascent cryptocurrency markets can offer particularly appealing Cash & Carry yields that are mainly due to insufficient fiat funding and counterparty credit risks, as well as the relative immaturity of the market and the absence of strong regulatory oversight.
EUA Emissions Allowances present an attractive opportunity to harvest positive yields on euro cash through a Cash & Carry trade in which the trader is long the EUA physical certificates while eliminating the market risk through a short EUA futures position.
EUA Emissions Allowances present an attractive opportunity to harvest positive yields on euro cash through a Cash & Carry trade in which the trader is long the EUA physical certificates while eliminating the market risk through a short EUA futures position. Since 2017, the futures curve has always been in contango and thus carries a positive implied yield. The physical certificates are the underlying commodity and have some special properties that allow for the Cash & Carry trade to be attractive. Firstly, one does not have to accept actual delivery of tons of CO2 gas. The physical certificates are just an accounting entry in the EU Union Registry system, recording who owns the emissions allowance. Secondly, there are no storage or insurance costs for holding this physical underlying. Lastly, these certificates no longer have an expiration date or a particular trading “phase” of the EU ETS in which they must be redeemed. These properties combine to eliminate many of the common costs of a Cash & Carry trade and lead to the EUA certificates being an attractive and secure (counterparty is the EU Union Registry) deposit alternative.
3 – Risk Management Considerations
Some of the difficulties that come along with this trade revolve around what the futures clearing houses regard as “good collateral.” The two potential clearing houses (ICE Clear Europe and ECC, the clearing house of the EEX in Leipzig) do not accept the EUA physical certificates as eligible collateral, although this has briefly been the case in the past. This leads to the market-neutral spread decomposing into two parts: a short futures position with contingent cash needs driven by variation margin, and physical EUAs that essentially become a “stranded asset” unless the trader can find a counterparty that’s willing to repo them, which can be challenging.
The two potential clearing houses (ICE Clear Europe and ECC, the clearing house of the EEX in Leipzig) do not accept the EUA physical certificates as eligible collateral, although this has briefly been the case in the past.
This stranded asset characteristic of physical EUAs can cause a cash crunch, which in turn could trigger an untimely unwind of the trade. A significant and fast increase in the futures price could result in a margin call situation as the physical long leg does not produce any offsetting cash flows. On the other side, if the futures price drops significantly, the trader will receive additional cash from variation margin, which is a drag on the overall performance of the trade, due to the current negative yields and broker funding spreads.
One possible solution to better manage the risk of an increase in the futures price is to find a counterparty that is willing to repo the physical certificates.
One possible solution to better manage the risk of an increase in the futures price is to find a counterparty that is willing to repo the physical certificates. The repo allows the trader to tap into the equity of the physical certificates for a fixed term and a nominal fee. Usual terms for such a repo require a haircut, or overcollateralization (e.g., some investment banks quote 25%), and may further have an absolute cap on available funding due to capital costs and balance sheet constraints. On the flipside, if the futures price drops, one could use the gains from the futures leg to purchase more certificates and increase the nominal exposure of the trade. Alternatively, one could take profits and unwind some notional exposure by selling off a proportional number of physical certificates in a scenario where the implied yield has contracted, and the Cash & Carry trade shows an attractive mark-to- market P&L.
4 – Trade Description and Historical Results
Below we discuss a conservative implementation of this Cash & Carry trade and share backtesting results from the EUA market, starting with the approval of the MSR (Market Stability Reserve) in 2017 to the present.
Assumptions:
- We buy the Daily Futures contract to receive the physical certificates in our registry account. This is a physically settled daily expiry contract, starting and ending on each trading day.
- The short futures leg is represented by the front December EUA futures contract, which is the most liquid and important price point on the curve. This contract is systematically rolled into the next December contract two months prior to expiration.
- We have an initial €100 mm cash position. In order to ensure a sufficient margin buffer, we limit the amount of notional exposure on our spread to €55 mm, leaving enough capital to purchase €55 mm worth of physical certificates while being charged 15% initial margin on the short futures leg (€8.25 mm). This leaves a cash buffer of €36.75 mm. Any variation margin as well as our cash buffer are assumed to be earning a paltry EONIA-30bps on a brokerage account.
- We have access to a repo facility to finance our long physical EUA certificates should our cash buffer of €36.75 mm become depleted. Nevertheless, we consider that this facility will have limited capacity and conservatively cap it at €100 mm. We can borrow at a rate of EONIA+75 bps.
As can be seen in the top left chart in Figure 1, in the first year of the backtest the spot price roughly triples, from about €7 to more than €20 per ton. The consequence is a large loss on the short futures leg, eating into the cash buffer as we must pay variation margin. Early in 2018, the cash buffer is already completely exhausted, eventually forcing us to borrow up to about €90 mm later in the year to stay in the trade. This is shown in the bottom left quadrant of Figure 1, while the chart on the top right displays the corresponding exposure of the trade, which goes up from 55% at the time of trade initiation to over 180% at the peak.
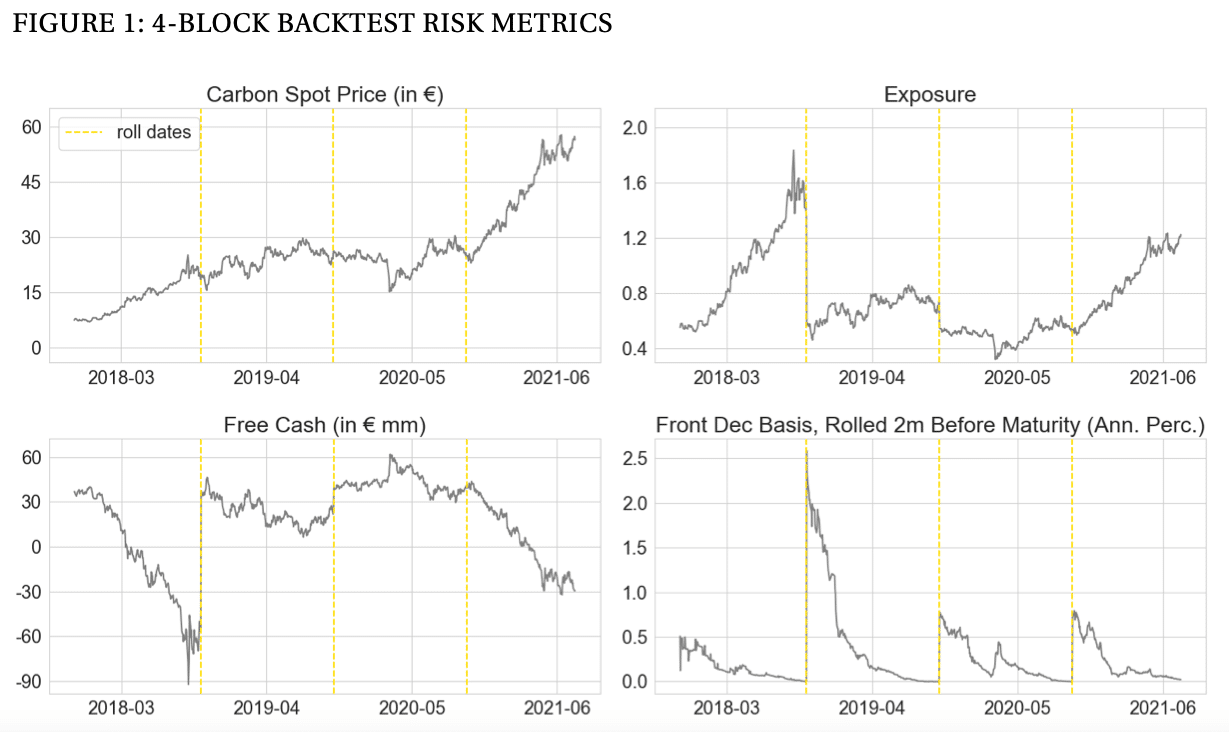
The bottom right chart shows how the basis evolves over time. In general, the longer the time to maturity, the richer the basis. Naturally, the basis collapses to zero as the expiration date gets closer. With each futures rollover we reset the trade notional to the initial exposure of €55 mm.
It can be seen that the strategy makes money as the basis contracts and the expiration date of the futures contract moves closer. At the end of 2018 the basis narrows considerably, mirrored by a rapid increase in the trade P&L, as shown in Figure 2. Throughout the backtest period the strategy earns an annual yield of 0.84% after interest on cash. Thus, the strategy accumulates a net gain of slightly above €3 mm. This comes at a low annualized volatility of daily returns of 0.58% and a maximum rolling monthly drawdown of 0.35%.
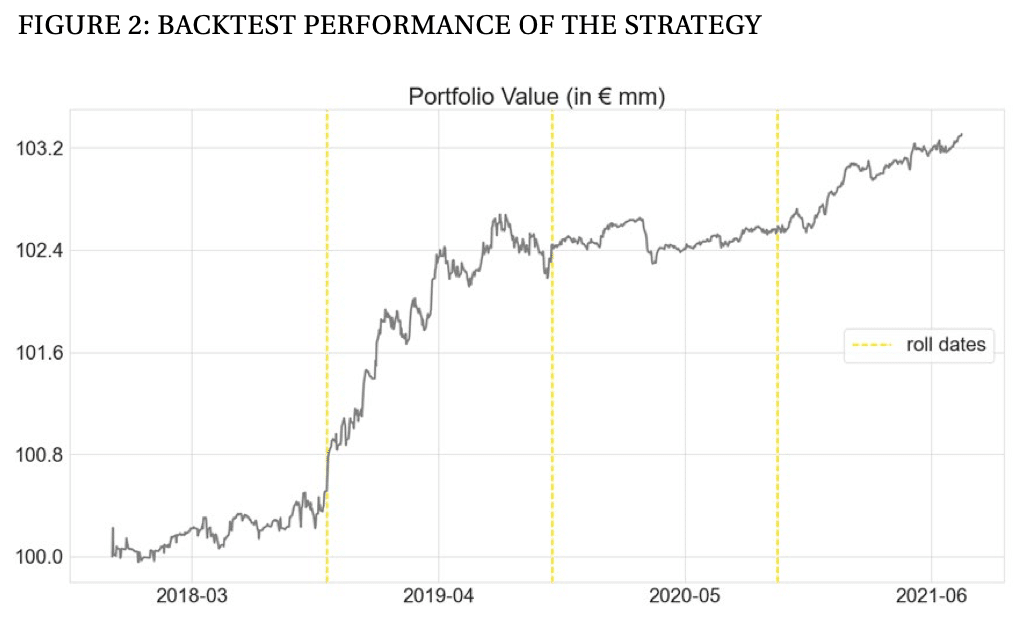
Note that these results are based on a conservative configuration and higher returns can be achieved with appropriate cash and risk management.
5 – Conclusions and Future Opportunities
As we have shown, the EUA Cash & Carry trade offers interesting opportunities for applying the traditional concept of Cash & Carry to emissions markets, given its positive absolute yields. Despite the negative interest rate environment, the EUA futures curve has been consistently in contango over the last years and absent any change in how physical EUAs are treated as collateral, we do not anticipate the market moving into backwardation anytime soon.
This article focused on the EU ETS Cap-and-Trade system, namely the EUA Emissions Allowances. As this new asset class is currently booming, expectations are that many more markets around the world with price curves presenting similarly appealing yields will emerge. The value of the EUA Emissions Allowances market is currently over €185 billion, comprising over 90% of the aggregate value for open Cap-and-Trade Allowance markets around the world, with Californica Carbon Allowances (CCAs) being a distant but rising 2nd place. China also recently launched an internal Cap-and-Trade market. While potentially huge, the Chinese market is currently still restricted to compliance entities within China. New Zealand and Korea both have small but growing markets. With other nations planning to implement similar measures to help achieve their decarbonization goals, we expect additional markets to emerge over the coming decade.
As this new asset class is currently booming, expectations are that many more markets around the world with price curves presenting similarly appealing yields will emerge.
Perhaps the biggest opportunity of all will be the Voluntary Carbon Offset market. There is much anticipation ahead of the proceedings of the UN’s COP26 in Scotland in November of this year. The hope is that the participants will finally be able to agree on clearly defined rules for the trading and accounting of carbon offsets between nations, as outlined in Article 6 of the Paris Agreement.
There have been several initiatives and new exchanges launched recently attempting to establish a benchmark for the Voluntary Carbon Offset markets. However, most of the hopes are focused on the efforts of the TSVCM (Task Force on Scaling Voluntary Carbon Markets), led by Mark Carney. Their aim is to set the global benchmark for carbon offsets which should then provide the necessary transparency, confidence and liquidity that will attract additional capital and finance experts into the global fight against climate change.
This article featured in HedgeNordic’s “Quant Strategies” publication.