An Alternative to the Classic 60/40 Portfolio
By Niels Kaastrup-Larsen, TopTradersUnplugged and Richard Brennan, ATS Trading Solutions: The historic hedging property of fixed income seen over the last 40 years has helped make the long only 60% Equity/40% Fixed Income portfolio a popular portfolio allocation method given the negatively correlated performance nature of so-called risky Equity assets against lower risk Bonds.
The equities boom post 2000 and the tail risk cushioning afforded by Bonds has significantly contributed to the popularity of this simple method of investment allocation.
A popular example of the 60/40 method is a 60% investment in an Index offering wide US stock market exposure such as the Standard & Poor’s 500 Index with a 40% investment that seeks to track the performance of a broad, market weighted bond index.
In this article we will use the very popular ‘Vanguard Balanced Index Fund (VBIAX) as a proxy for this classic method of Buy and Hold investment allocation.
A 100% buy and hold allocation in the S&P500 Index would have delivered the following performance returns since 1st January 2000 to 31st July 2021.
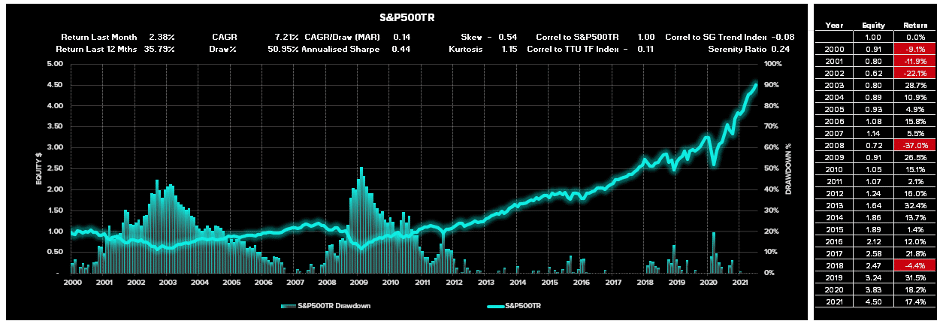
Figure 1 shows a Compound Annual Growth Rate (CAGR) of 7.21% per annum however we note two significant plus 45% Drawdowns in 2003 and 2009 associated with equity crisis periods. Such extreme drawdowns during unfavourable equity regimes make a 100% allocation towards this style of Buy and Hold investment:
- difficult to psychologically tolerate;
- contingent on optimal timing of investment entry that may take months or years to recover; and
- dilutes the impact of compounded returns over the long term which impedes wealth generation.
The relationship between the CAGR and the Maximum Drawdown provides a path dependent risk adjusted ratio referred to as the MAR ratio (CAGR%/Max Draw%). Low ratios reflect volatile returns for an investor. In the example of Figure 1, the MAR ratio is a low 0.14.
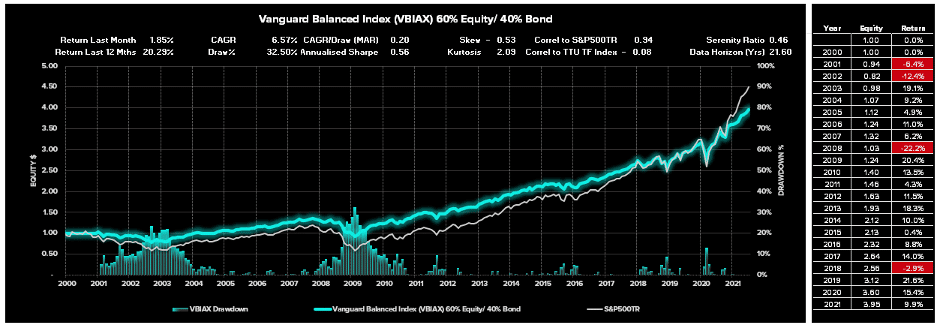
In contrast, VBIAX has significantly cushioned this volatility impact without severely compromising CAGR. Figure 2 shows a 6.57% CAGR which is slightly lower than a 100% allocation in the S&P500, but with far lower drawdowns that range between 25% to 32.5% over the same period. This less volatile ‘smoother ride’ leads to a higher risk adjusted return with a MAR ratio of 0.20.
Strong performance results of Figure 2 support the popularity of the 60/40 Equity/Bond Portfolio since 2000 to current day.
Will Future Performance be the Same as Past Performance?
The power of this ‘long only’ approach to “Buy and Hold” lies in the embedded assumption that US equities and US Treasuries will continue to display growth in the future and that bonds will continue to provide tail risk protection to investors in times of equity crisis.
However, there are some major factors that concern allocators such as:
- Treasury Yields are at all-time lows – The ultra-low interest rate environment is here to stay for a while at least which means that bonds are no longer a reliable source of income and high allocations towards traditional bond portfolios are unlikely to produce meaningful returns in the future while these conditions persist.
- Investors need to consider a Rising Inflationary Environment – Rising production costs and relaxed central bank Quantitative Easing combined with various stimulus packages could lead to rising inflation in the medium term. Rising inflation is bad news for fixed income investors as it increases bond yields and correspondingly drives down the valuation of bond portfolios. Furthermore, inflation dilutes real returns.
- Equities and Bonds do not offer Sufficient Diversification Alone – The negative correlation between Bonds and Equities has been a recent phenomenon (since the late 1980’s) up to April 2020, but post Covid we have seen the correlations turn positive. Furthermore, over the prior 65 years pre-1980’s, Bonds and Equities have exhibited positive correlation.
Consequently, given these building concerns, many allocators are recommending that instead of allocating 60% broadly to stocks and 40% to bonds, prudent investors should consider different weights and/or even better, diversifying into a broader array of uncorrelated asset classes.
Introduction to the Serenity Portfolio
There are many options available to investors seeking to diversify their portfolios into more robust uncorrelated alternatives than bond portfolios. One such asset class that strongly features in ‘Alternative investments’ as a powerful diversifier are the Globally Diversified Systematic Trend Following Managers.
This group of Managers place a great deal of emphasis on methods of diversification within their trend following models in terms of geography, asset class, system design, and timeframe to name a few.
Historically Trend Following Managers are almost perfectly uncorrelated to the S&P500 Index. This uncorrelated relationship can be attributed to the extensive diversification achieved by this investment style which naturally is therefore uncorrelated to a single asset class such as equities. This uncorrelated relationship is therefore expected to continue. Furthermore, this style of investment has historically performed very well during inflationary regimes.
The authors of this article have produced a paper that provides a powerful allocation method referred to as ‘the Serenity Allocation’ that selects top long-term Trend Followers from a pool of globally diversified Managers with a long-term track record. The research paper looks under the hood of this powerful risk adjusted selection method and will shortly be available for download through the Top Traders Unplugged website.
The Serenity allocation is not only a very powerful method to consider for a 100% allocation of investment capital, but it also provides a very powerful diversifier for those investors that want to replace their 40% bond allocation with an alternative uncorrelated asset class, that has a track record of performing well during uncertain periods and across a broad class of different inflationary regimes.
A Brief Overview of the Serenity Allocation Method
The Serenity Allocation method is a process that can be applied for investors seeking to allocate a minimum of $500K towards this alternative investment class which avoids any possible hindsight bias and allows the investor to select suitable Trend Following candidates that have a long-term track record in delivering excellent risk adjusted returns.
The method looks at a broad selection of Managers and assumes a minimum $500K investment which is equally allocated to 5 programs that meet the following definition:
- Are currently active Programs;
- Possess at least a 15-year track record;
- Are globally diversified and invest across a broad array of asset classes;
- Are fully systematic in nature using quantitative rules-based processes;
- Adopt Trend Following trading methods;
- Offer pooled Onshore and/or Offshore investment vehicles; and
- Allow for a Minimum investment of $100K.
From this selection of current Managers that meet this definition, we then undertake an annual rebalancing process that evaluates using the Serenity Ratio an optimal allocation for the next 12 months.
This Serenity Ratio, unlike the Sharpe and Sortino ratio, is a ‘path dependent’ risk adjusted metric used for investment selection which evaluates the degree of autocorrelation in a portfolios equity curve and estimates both the average and extreme risks carried by a Portfolio.
The Serenity ratio is used to identify a selection of 5 programs that offer superior risk adjusted returns and can meet minimum investment capital requirements of $500K.
Using a 15-year rolling window, we annually assess the performance of each program using the Serenity Ratio and choose the top 5 ranked performers from the selection as our next 12-month investment selection. Each year we equally allocate our total investment equity towards the top 5 performers selected from this process.
Performance Results of the Serenity Method
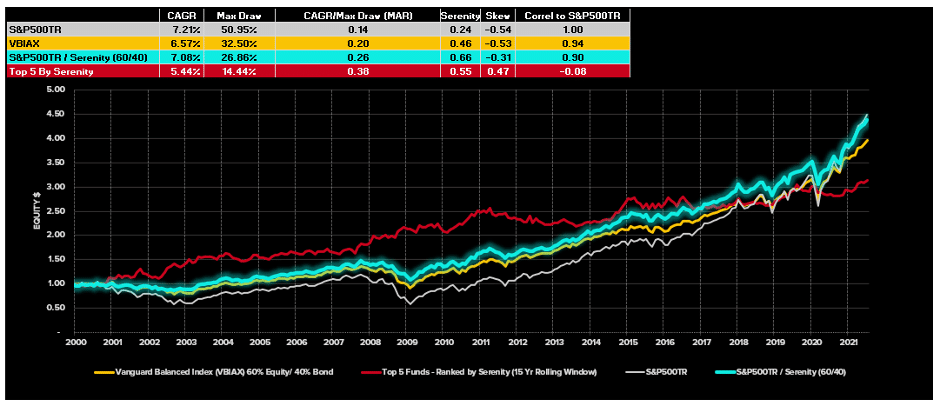
Under a 100% allocation towards the Serenity Portfolio, Figure 3 reflects a CAGR for the 21-year period of 5.44% per annum with a maximum drawdown of 14.44%. The risk adjusted MAR ratio that reflects the relationship between CAGR and the Maximum Drawdown is 0.38 which is far superior to a 100% investment in the S&P500 or a 100% investment in the VBIAX. A smoother ride is achieved through this allocation than these alternative allocation methods without a significant sacrifice in CAGR.
Such low levels of drawdown allow those investors with a higher risk appetite to include a degree of leverage in their funding allocation to achieve higher returns with commensurate increases in overall maximum drawdown. However, for the purposes of this assessment, we have excluded the potential to enhance returns through leverage.
You will notice in Figure 3 that the Top 5 programs ranked by the Serenity Ratio are almost perfectly uncorrelated with US equity market with a Pearson Correlation Coefficient of -0.08 for the performance history since 1st January 2000. And perhaps more importantly, it is unlikely that these systematic globally diversified Trend Following managers will ever become highly correlated with US Equities given their geographic and system diversification.
Performance Results of the 60% Equity 40% Serenity Portfolio
From our research we can also demonstrate the power of the Serenity allocation method in delivering powerful risk adjusted returns to a balanced portfolio when we replace the 40% Bond allocation with a 40% Serenity allocation across Trend Following managers using this process.
As can be seen in Figure 3, a 60% Equity and 40% allocation towards the Top 5 by Serenity Ratio produces a CAGR of 7.08% with a Maximum Drawdown of only 26.86%. This risk adjusted performance already exceeds the performance of the VBIAX and is likely to continue outperforming under an uncertain future with prospects of inflation tail winds rising.
Research Paper
This article introduces you to our research that we will shortly be releasing on Top Traders Unplugged.
This article featured in HedgeNordic’s “Quant Strategies” publication.
Photo by Nicholas Cappello on Unsplash