Correlation and Beta – Searching for Diversification
By Linus Nilsson, NilssonHedge – While the oft-repeated mantra that correlation is not causation, it is often a starting point for further discussions about the static and dynamic exposure of hedge fund strategies. It can indicate how a strategy has been positioned, or if there are static exposures within a strategy. NilssonHedge, a hedge fund database, and index provider provide continuously updated correlation and beta estimates for our daily performance indicators. These will help you to form and update your expectations on the likely future performance of a strategy given a market development. For instance, is your diversification benefit static or dynamic?
The mathematics of correlation and beta calculations are remarkably similar but give slightly different information. A manager may be highly correlated to a market, but if the beta is low, then the impact on your portfolio will likely be low in financial terms. It may also reveal differences in volatility. Both are linear measures, and as Anscombe’s quartet illustrates and to paraphrase him: while the numerical calculations are exact, always look at the data to find any non-linearities in it.
For our analysis, we use rolling 21-days (roughly equal to the number of trading days in a month) correlation and beta for three out of the five daily hedge fund indices that we calculate. These measures give an indication of exposure and how the underlying managers have been positioned.
We will go through the three different liquid style and will discuss specific features of each strategy, and how they can contribute to diversification in your portfolio. Note that our indices represent aggregates of managers and any individual strategy in your portfolio could behave substantially differently.
These calculations give you a clue, not only about contemporary exposures but also about the trading style. The charts should be interpreted with some skepticism as they do not necessarily reflect the underlying exposures but may only be a mathematical mirage and a high or low correlation may not be related to the market selected. For this article we will focus on the main risk in diversified portfolios, equity markets.
Our full report shows Beta and Correlation against US Equity markets, US Bonds (10-year), Currencies (as short exposure to the US Dollar), Energy (US Crude Oil), Precious Metals (Gold), and Crypto Currencies (Bitcoins). We use a basket of large ETFs to calculate the statistics. For portfolios where the underlying portfolio consists of international exposure, please be aware that for instance differences in closing times may create a perception of lower than actual correlation. In addition to the indices covered here, we also calculate Market Neutral and Event Driven indices.
Being the largest style in the hedge fund space, Equity Long/Short managers comes in different flavors; but when looking at the combined manager behavior, we find a remarkable consistency in terms of beta and correlations. For our indices, we find a high and stable correlation of near one with equity markets, but with a lower beta of approximately one half. The implications are that you should expect half the drawdowns, but they are almost assured to hit at the same time as the rest of your portfolio is suffering.
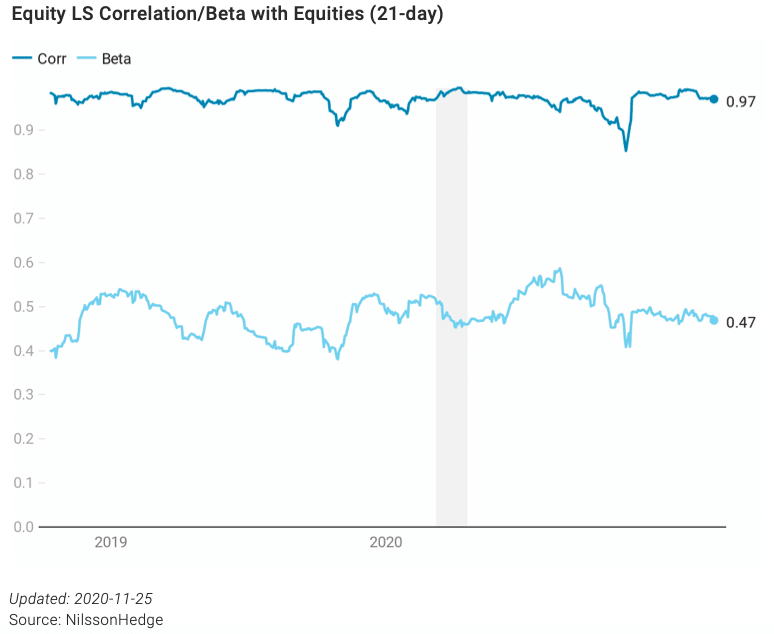
Plain vanilla Equity L/S fund may thus not be the expected diversifier, but rather as a potential risk reduction in an asset portfolio. Diversification can certainly be found here, but you should ensure that the funds you are looking for do something differently than your average fund.
Market Neutral and Event Driven strategies have interesting properties from a diversification perspective. Both have a low beta to the major risk factor but have time-varying correlations which may result in less than optimal portfolios. Event Driven strategies do also have a dependency on financing conditions, which may lead to increased beta at the wrong time.
Managed Futures
CTAs generally do have time-varying exposures to all the Global Macro markets. As the NilssonHedge index mostly consists of Trend Following managers implying that the co-movement data will largely be a factor of how markets have behaved in the recent past. Long exposures to markets will generally be taken once a positive trend has been established, resulting in positive correlation. Short exposures to markets will generally be taken once a negative trend has been established, resulting in negative correlation.
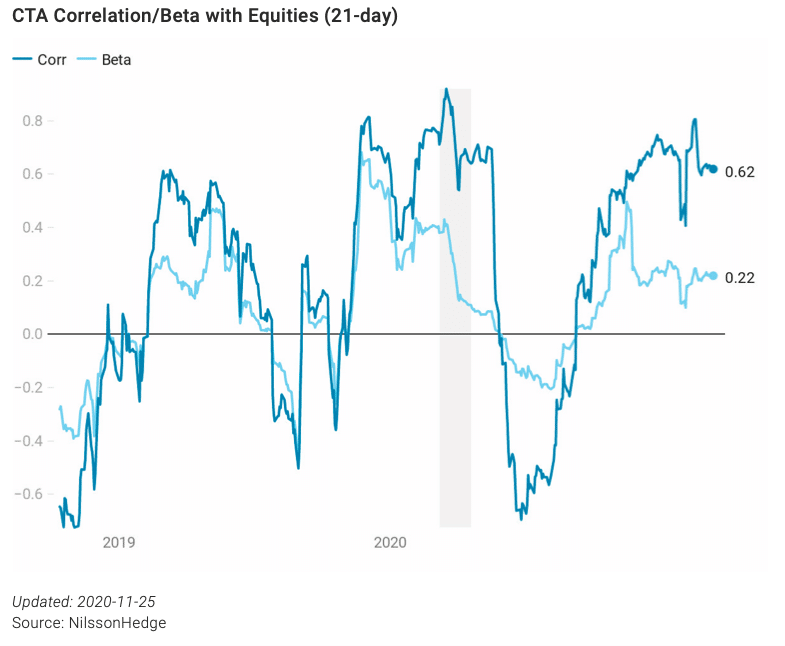
Effectively, this means that you cannot be sure how CTAs will behave during a correction or a market move as their exposure is dependent on what has happened recently. You are much more likely to get equity market diversification in a secular bear market rather than during a long-term upward move. That also implies that the hedging capabilities of CTAs against equity markets is far from assured but depends on how markets have moved prior to a correction.
Crypto Managers
Crypto trading is the new kid on the block, representing managers that have exposure to a diverse range of digital assets. The asset class is small, lacks established funds, and comes with a variety of interesting issues. Several of the managers are far from institutional quality and Due Diligence requires exceptional understanding of the asset class and the risk within. However, correlation and beta sensitivity do not seem to be one of them.
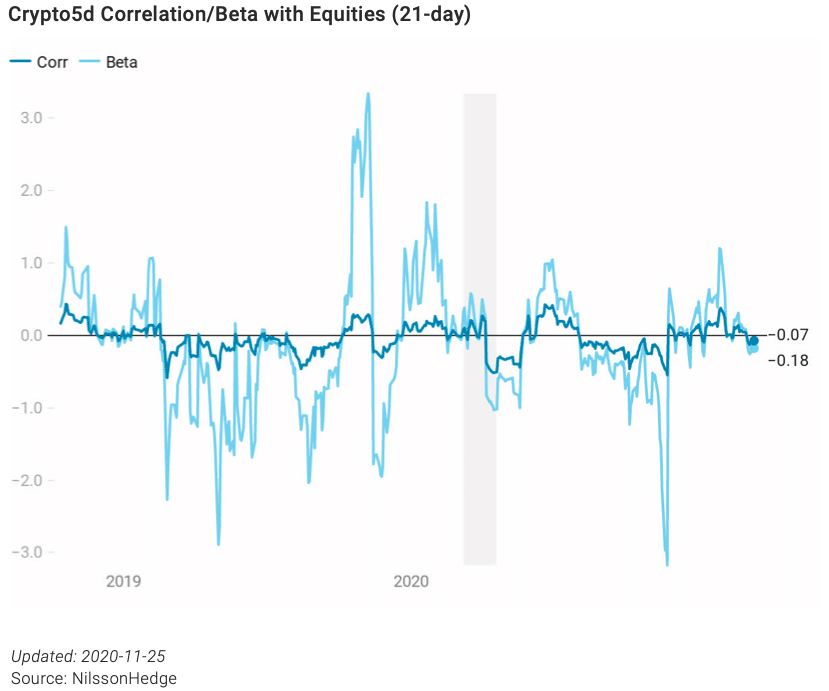
The strategy, perhaps given its small size, is rather decoupled from financial assets. The index we maintain is not even correlated with Bitcoins, the largest digital asset out there. While trading strategies in Digital Assets are novel, managers in this strategy could offer some interesting properties. The high beta reveals that Crypto Managers are (much) more volatile than other markets.
Ending Words
Searching for truly diversifying alternatives is never easy and many investors are, given the preponderance of evidence by asset allocated to certain strategies, looking in the wrong areas. We have demonstrated that stock picking strategies have a high correlation to equity indices and that other strategies, such as Event Driven, may have unfavorable stress risk behavior as demonstrated during the spring of 2020.
We find that CTAs have semi-predictable correlation characteristics driven by medium-term trends. Amongst our indices, the most promising candidate for finding diversification is trading done by manager trading in digital assets. The novelty of the asset class may lead to low correlation although could increase in the future if there are additional linkages between real and digital assets. For the time being, we struggle to find any major market that this index is correlated to.
Our database is limited to relatively liquid strategies and there may be segments of the markets that could offer interesting diversifiers, such as alternative credit or strategies that invest in other types of securities.
If you are searching for non-persistent correlation and beta, be prepared to take uncomfortable decisions and you should be willing to deploy capital to markets that are functionally unconnected to financial assets. Daily updates of the charts in this article are available at https://nilssonhedge.com/reports/hedge-fund- correlation-and-beta/.
Bio: Linus Nilsson founded NilssonHedge, a public hedge fund database, as an initiative to bring transparency to the hedge fund universe. The database uses an innovative way of aggregating public performance data and offers access to hedge fund returns. Access the database at www.nilssonhedge.com.
Disclaimer
This article featured in HedgeNordic’s report “True Diversifiers.”
Photo by Lin Jhih-Han on Unsplash