CTA Style Evolution
Stockholm (HedgeNordic) – Over the past few decades, the systematic CTA space has evolved as markets change, competition increases, and new tools and techniques are applied to find trends and other opportunities. Strategies and approaches that were once highly innovative have become more mainstream, more publicized, and better understood by investors. In this note, we use a set of over 50 systematic strategies to measure differences and themes in CTA styles both over time and across managers. Our approach allows us to document two key themes in the CTA space: trading speeds and style tilts. At the aggregate level, we find that managers have added more trading styles over time and that trend speeds have slowed down. We also find that style choices do vary across managers.
Analyzing CTA Styles
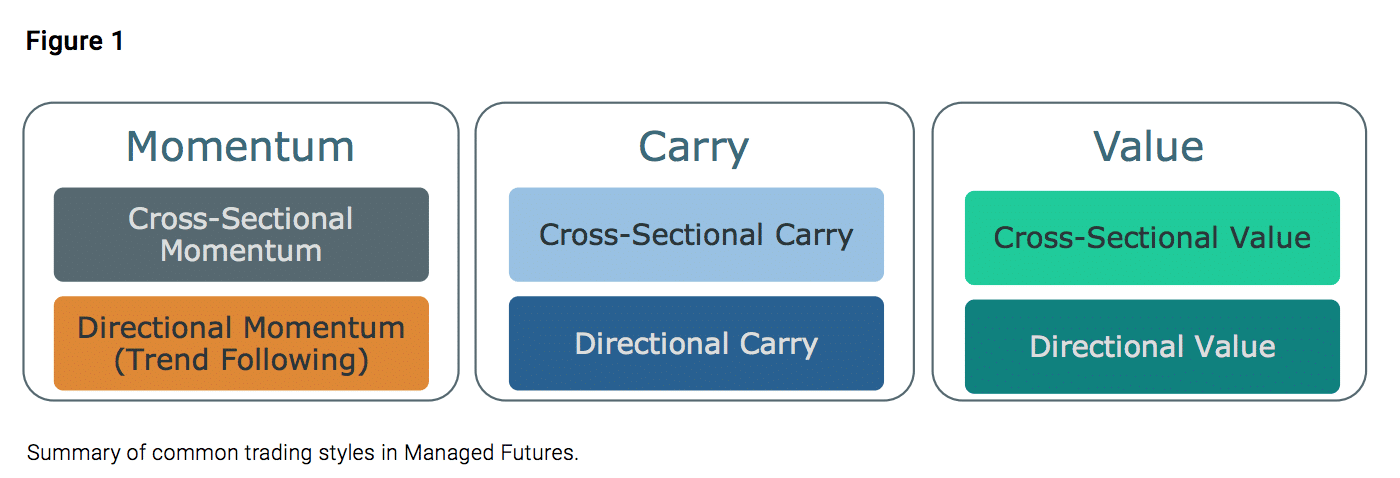
Quantitative CTA managers trade a range of different identifiable strategies, commonly known as risk premia, in an attempt to capture certain features of market returns. The most common investment styles are momentum, carry, and value. The implementation of these styles can be either directional (dir) or cross-sectional (cs). Directional models allow for a net long position or net short position across time whereas cross-sectional models often have market neutral exposure over time.1 Figure 1 provides a summary of these styles. Arguably, the most common strategy is long risk premia which involves simply holding an asset. To encompass a wide range of potential style choices available to a systematic manager when creating a strategy, we consider four key dimensions:
(1) Investment strategy or style (momentum, carry, value, and long risk premia);
(2) Implementation approach (directional or crosssectional);
(3) Time horizon (ranging from 2 weeks to up to 5 years);
(4) Asset class allocation (equities, fixed income, currencies, and commodities).
Given a manager’s returns, we follow an iterative process to find the set of factors and their corresponding allocation tilts that best describes the return series (for more information, see endnote). The result of this process is a “factor representation” with risk loadings and selected factor sets to represent a CTA portfolio. These factor sets can then be used to better understand what styles, speeds, and asset class tilts may be driving the manager’s returns.
Analyzing Styles Across Time
Over the last few decades, the CTA industry has grown from a boutique industry to one of relative scale. Some have claimed that over time CTA managers have evolved from pure trend into a more multi-style approach. One simple way to examine this conjecture is to consider how the average CTA’s strategic factor weights and styles have changed over time. To do this we take short slices of CTA index returns and examine their “factor representations.” Using the SG Trend Index, SG CTA Index, and the somewhat newer SG CTA Mutual Fund Index, we divide return histories into four-year intervals and examine how the style of CTA strategies may have changed. Figure 2 plots the style decomposition in percentage terms for each of these indices over time.2 These factor loadings are grouped together by theme to simplify the 50+ possible factor choices. Taking a closer look at Figure 2, we can make several key observations. First, the average speed of trend appears to have become more evenly diversified across time horizons. During the most recent period, the overall influence of long risk premia seems to be more pronounced in the SG CTA and SG CTA Mutual Fund Index. Outside of trend strategies, there appears to be a moderate amount of momentum, carry, and value being used in the CTA space.
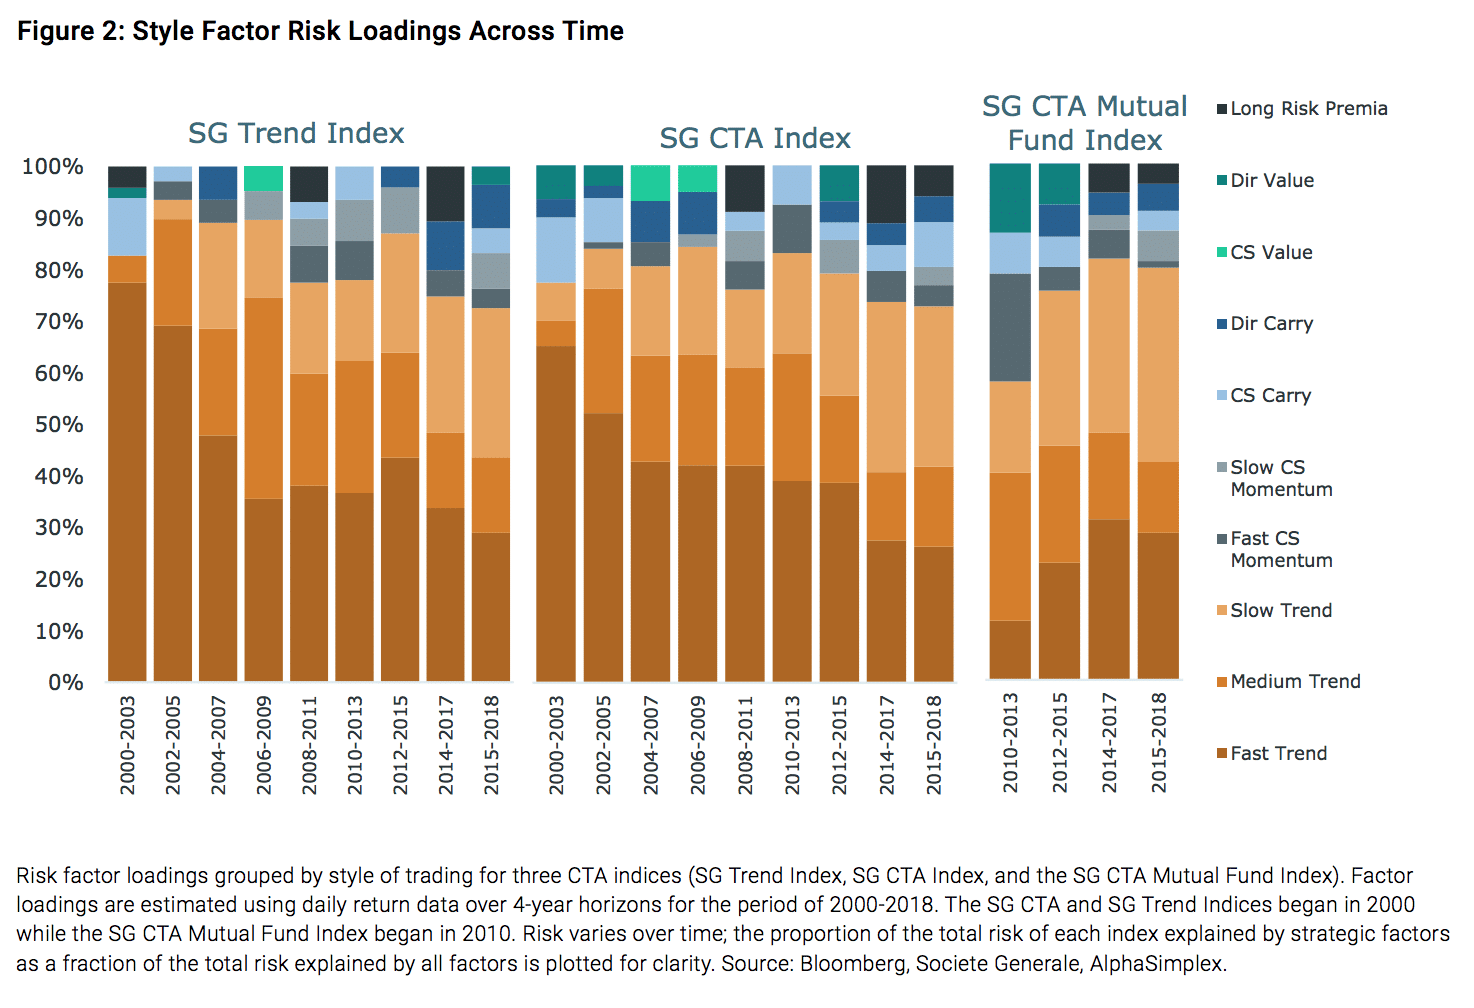
From Figure 2 we can also see that since 2000 there has been a clear reduction in the speed across the space towards slower trend speeds. For the recent periods, programs in the SG CTA Mutual Fund Index have seemed to focus more on long-term trend (9 to 12 months) and short-term trend (2 weeks to 4 months) with mediumterm horizon trend (5 to 8 months) showing less risk weight. For investors interested in the potential for “crisis alpha” or risk mitigation, several studies suggest that (1) faster trend speeds tend to navigate crisis better and (2) non-trend strategies tend not to be as successful in crisis periods as trend. The presence of long-only asset class risk premia also suggests the potential to be negatively exposed to any crisis event in exchange for better performance outside of crisis periods.
Comparing Styles Across Managers
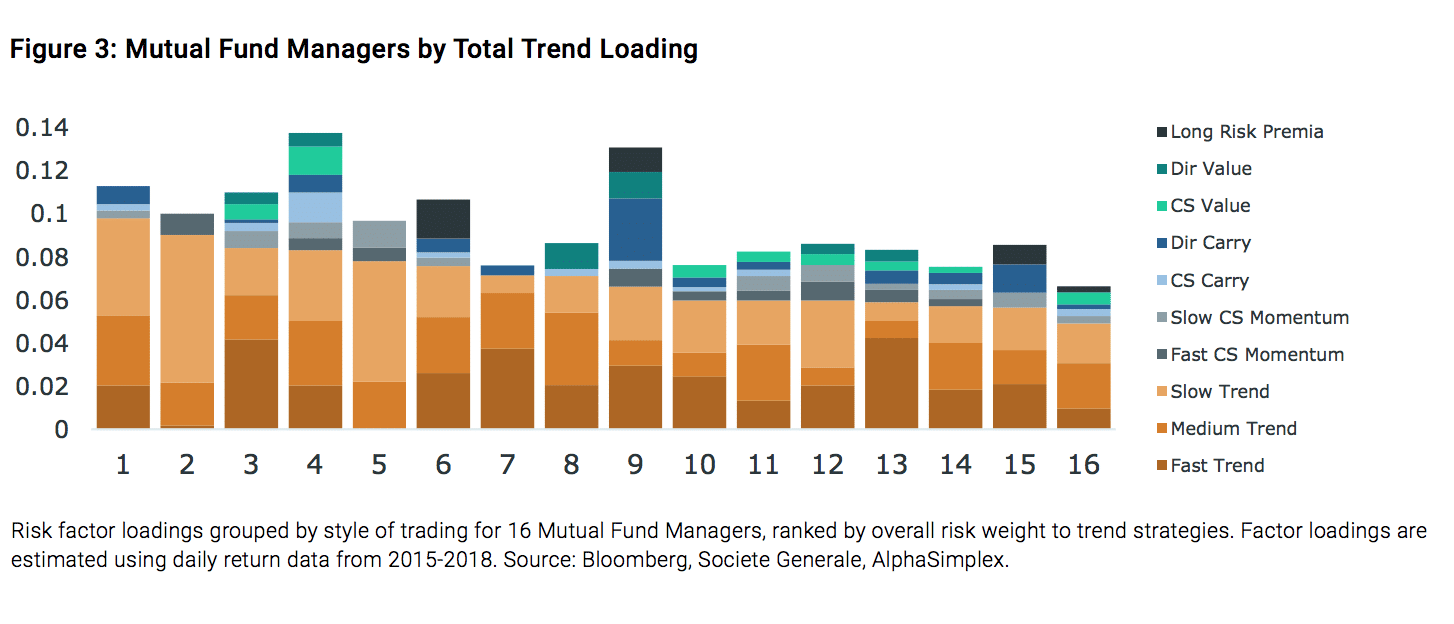
Given the style drift over time across the industry, as measured using the index returns, we consider how style choices vary across a set of managers over the recent period. Using daily return data from 23 Managed Futures 1940 Act mutual fund managers from 2015-2018, we consider their representative factor loadings. Figure 3 plots the factor loadings for 16 managers with at least a 40% R-squared value from our two stage iterative process.3 The Mutual Fund managers are ranked by their overall risk weight to trend strategies. From this graph, we can clearly see that some managers use more non-trend strategies than others, including crosssectional momentum and strategies such as value or carry. There are several managers with long asset class risk premia exposure. The ratio between trend and nontrend strategies varies across the space. For example, Manager 2 has mostly trend driving returns whereas Manager 9 has a roughly even split between trend and non-trend strategies.
Summary and Conclusions
Systematic managers in the CTA space incorporate a wide range of trading styles across time horizons, implementation style, and asset classes. These styles vary both over time and from manager to manager. Using over 50 factors across trading styles, time horizons, trading approaches, and asset classes applied to CTA index-level return data, we estimate how CTA styles have evolved over time and find that (1) trend speeds have slowed down and (2) more non-trend and long risk premia seem to be present in CTA strategies in the recent past. These results represent the aggregate trends in the industry but may not be representative for each individual manager. We also consider daily returns for mutual fund managers and examine how styles vary from one manager to another. We find that the trend speed and ratio of non-trend strategies also vary across managers.
1) Managers may define market neutrality differently, e.g., sector beta neutral, volatility adjusted position neutral, or net position neutral.
2) Since the volatility profile for CTAs has come down since 2000, we use the percentage contribution for each factor to compare them directly.
3) Managers with low R-squared values or short history were removed from the evaluation, as the factor loadings do not represent the performance of these funds. The funds that were removed were often short-term only or have a short history.
Endnote
Our factor specification is an iterative process that includes two main stages, inspired by classic ExpectationMaximization techniques. First, the entire factor set (50+ factors) is winnowed to an initial factor set using penalized non-negative regression. Second, these factors are fit, on a factor by factor basis, to determine the asset class allocation mixture for each factor that best describes the residuals of the fund/index return series after regressing the remaining selected factors. Finally, after each factor’s asset class allocations are identified, a final non-negative factor selection process is used and factor weights that are no longer significant are dropped from the factor set. Non-negative regression helps deal with the high correlation across different factors where we assume that managers only go long quantitative strategies and do not go against the underlying investment strategies. This means the managers do not take the opposite sign of the classic set of risk premia strategies; the managers may take long or short positions.
References
Greyserman, Alex, and Kathryn M. Kaminski. 2014. Trend Following with Managed Futures: The Search for Crisis Alpha. Hoboken, NJ: John Wiley & Sons, Inc. Kaminski, Kathryn M. 2011. “In Search of Crisis Alpha: A Short Guide to Investing in Managed Futures.” CME whitepaper.
Authors:

This article featured in HedgeNordic´s special report on systematic strategies in June 2019
Title Picture: (c) By ananaline—shutterstock.com