Nordic CTAs – rock solid start to 2016
Stockholm (HedgeNordic) – Nordic CTAs had a rock solid start to 2016. Summarizing the performance for the first quarter reveals that the NHX CTA, a composite index of all CTA programs in the Nordics, gained 6,1% during the period, thereby more than recovering the losses from the previous year in a three month stretch. NHX CTA outperformed global benchmarks, both in absolute and risk adjusted terms.
There were no negative numbers to be reported during the period as the accumulated gains that were recorded in January and February were more than enough to cope with the losses experienced in March. Managers overall benefited from the turbulence experienced in the first two months exploiting the bearish trends that developed in commodities and equities while holding on to long fixed income positions.
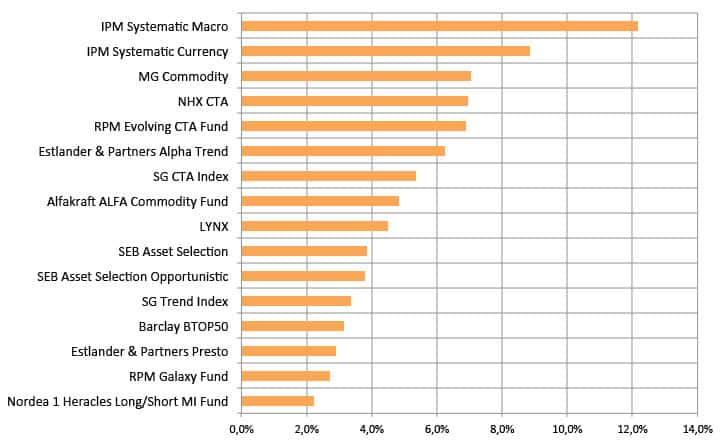
Among individual programs, IPM Systematic Macro, RPM Evolving CTA and IPM Systematic Currency stood out as the strongest performers in absolute terms. On a risk adjusted basis, the two funds from IPM came out on top (see chart 1 below).
Having experienced a dull year in 2015, the CTA industry seems to be back on track following the pick-up in volatility seen in the first quarter of 2016. Once again, the strategy shows its worth in times of equity market distress. It remains to be seen if the March downturn was just a temporary setback in a long-term positive trend for the CTA industry, an increased risk awareness in global financial markets suggest more pressure on risk assets and more volatility ahead, a market typically loved by the strategy.
Table 1. Performance ranking Nordic CTAs – Q1 2016
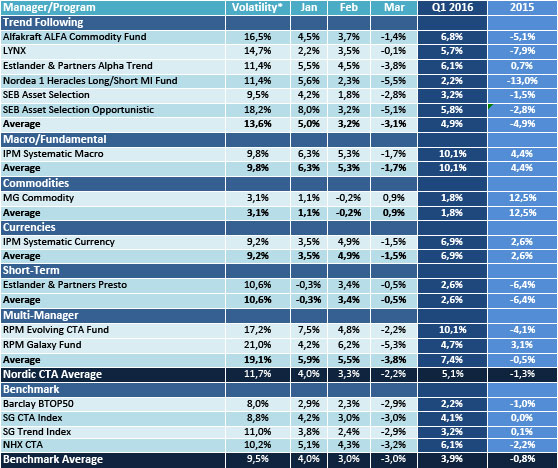
Table 2. Risk-adjusted performance ranking Nordic CTAs – Q1 2016
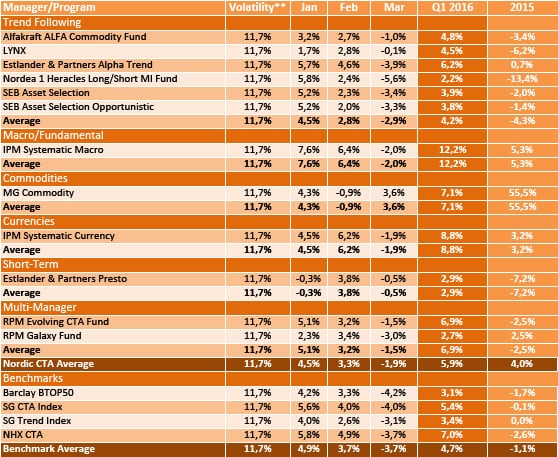
Chart 1. Risk-adjusted performance ranking of individual CTA programs – Q1 2016
Picture: (c) everything-possible – shutterstock.com_120