Nordic CTAs end disappointing year in the red
Stockholm (HedgeNordic) – Nordic CTAs posted losses in the fourth quarter of 2015, ending the year in the red. The NHX CTA Index, a composite of Nordic CTAs performance compiled by HedgeNordic, shed -3.2 percent in the final three months of the year to finish 2015 down -2.2 percent. Nordic CTA-returns were weaker compared to benchmarks where the Barclay BTOP50 Index ended the year down -1.0 percent while the Newedge CTA indices (nowadays called the SG Prime Services Indices) finished the year more or less unchanged.
2015 offered somewhat tricky trading conditions where financial markets went from a risk-on stance in the first five months of the year to a risk-off mode starting during the summer as concerns over the Chinese economy and a collapsing oil price mounted. Nevertheless, the CTA-year of 2015 must be regarded as disappointing given exploitable trends seen in energies, metals and currency markets in particular.
Among Nordic CTA sub-strategy groups, trend following managers were generally down with industry giant LYNX posting a -7.9 percent loss for the year. SEB Asset Selection also struggled finishing down -1.5 percent. Nordea’s Heracles Long/Short MI Fund was the big loser among trend followers posting a loss of -13 percent year-to-date.
Among sector specific CTAs, commodity focused MG Commodity had a stellar year, putting in a positive 12.5 percent to a very low volatility profile. The Swedish quant FX program, IPM Systematic Currency, also managed to eak out a 2.6 percent gain, following a strong run in December.
On the macro side, IPM’s systematic macro fund also did well gaining 4.4 percent on the year. Estlander’s Global Markets program was closed during the year and taken out of the comparison.
Another program that decided to close to outside investors during the year was Romanesco’s Persistence Program, this was reported in a separate HedgeNordic article. The only short-term CTA program left in the comparison is thus the Estlander Presto account which suffered losses of -6.4 percent in 2015.
On the multi-manager front, the funds offered by Swedish CTA-specialist RPM showed mixed returns during the year. The RPM Evolving Fund, investing into smaller up and coming CTA managers lost -4.1 percent while the GALAXY fund, that invests into a set of more established CTA-names, gained 3.1 percent. GALAXY is a newly added fund to the comparison given RPM’s decision to make the fund available to investors in the Nordics through Swedish fund platforms (see HedgeNordic article here), the full track record dates back to 2008.
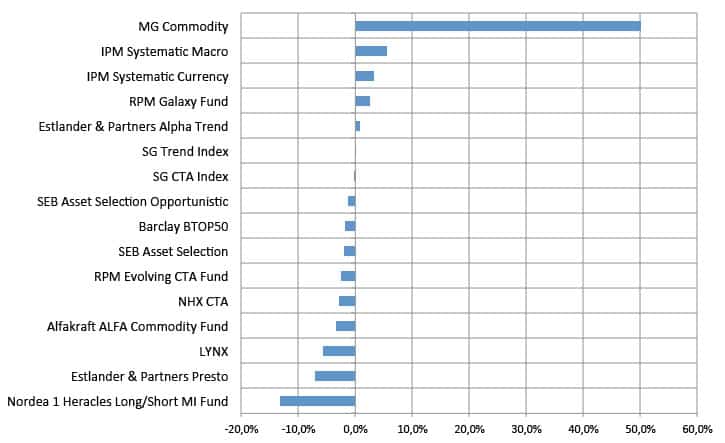
Chart 1 and 2 provides risk-adjusted (all programs adjusted to the average volatility of Nordic CTAs) snapshots of individual manager performance rankings for Q4 2015 as well as for the full year. The indisputable winner for the year is MG Commodity while the Nordic CTA space overall struggled.
So what is in the cards for CTAs in 2016? A heightened risk awareness in global financial markets might be a trigger for CTAs to start delivering outsized and uncorrelated returns again. Mounting fears for a slowdown in China, collapsing oil prices, the Feds hiking cycle leading to increased global interest rates divergence are only a few factors that may play into this. As always, CTAs tend to work well in times of equity market distress, let us see if the start to 2016 holds any clues about CTA-performance for the full year…
Table 1. Performance overview of Nordic CTAs 2015
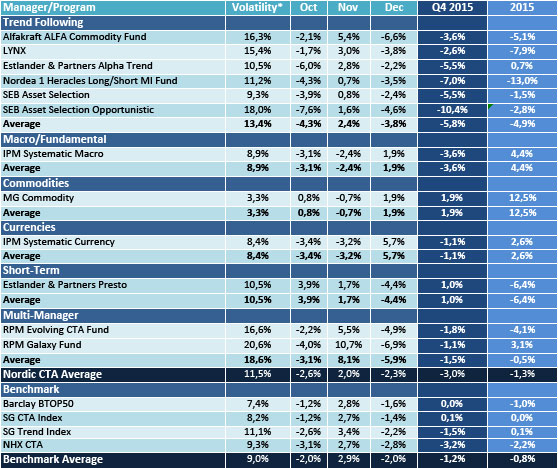
Table 2. Risk-adjusted performance overview of Nordic CTAs 2015
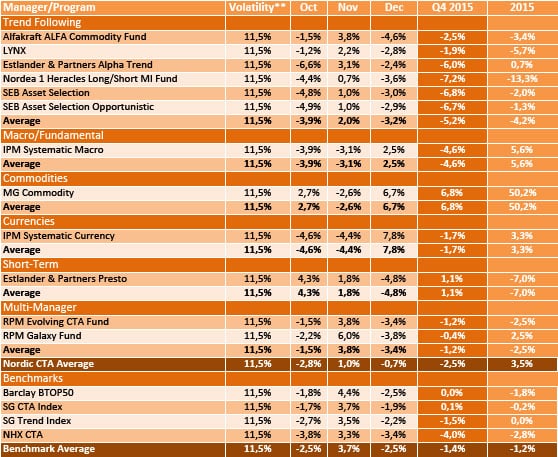
Chart 1. Risk-adjusted ranking of Nordic CTAs – Q4 2015
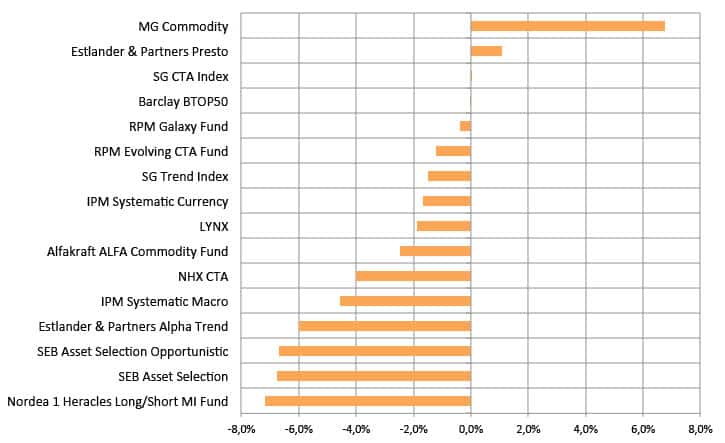
Chart 2. Risk-adjusted ranking of Nordic CTAs – 2015
Picture: (c) pabmap —shutterstock.com